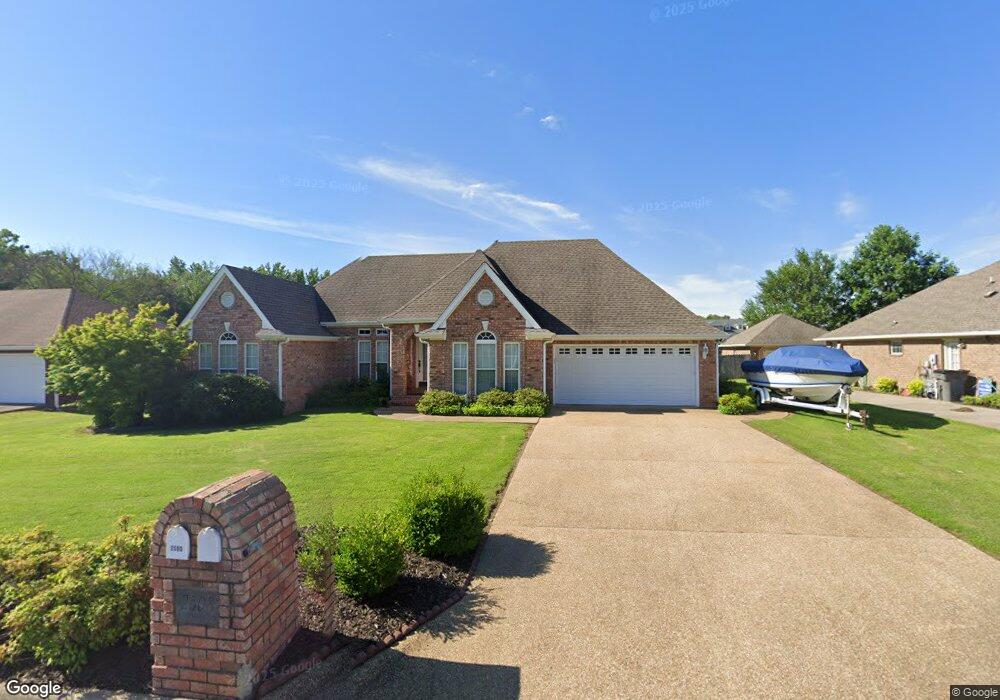
2508 Christopher Dr Paragould, AR 72450
Estimated Value: $254,000 - $280,000
3
Beds
2
Baths
1,966
Sq Ft
$136/Sq Ft
Est. Value
About This Home
This home is located at 2508 Christopher Dr, Paragould, AR 72450 and is currently estimated at $266,988, approximately $135 per square foot. 2508 Christopher Dr is a home located in Greene County with nearby schools including Greene County Tech Primary School, Greene County Tech Elementary School, and Greene County Tech Intermediate School.
Ownership History
Date
Name
Owned For
Owner Type
Purchase Details
Closed on
Apr 6, 2021
Sold by
Stratton Leslie and Estate Of Charles Leslie Barre
Bought by
Stratton Leslie
Current Estimated Value
Purchase Details
Closed on
Jul 24, 2017
Sold by
Henfling Scottt and Henfling Maria
Bought by
Stratton Keith
Home Financials for this Owner
Home Financials are based on the most recent Mortgage that was taken out on this home.
Original Mortgage
$173,737
Outstanding Balance
$144,075
Interest Rate
3.91%
Mortgage Type
New Conventional
Estimated Equity
$122,913
Purchase Details
Closed on
Oct 11, 2005
Sold by
Coleman Harold and Coleman Doris
Bought by
Henfling Scott and Henfling Maria
Home Financials for this Owner
Home Financials are based on the most recent Mortgage that was taken out on this home.
Original Mortgage
$136,171
Interest Rate
5.65%
Mortgage Type
New Conventional
Purchase Details
Closed on
Jan 23, 1998
Bought by
Harold and Doris Coleman
Create a Home Valuation Report for This Property
The Home Valuation Report is an in-depth analysis detailing your home's value as well as a comparison with similar homes in the area
Home Values in the Area
Average Home Value in this Area
Purchase History
| Date | Buyer | Sale Price | Title Company |
|---|---|---|---|
| Stratton Leslie | -- | None Available | |
| Stratton Keith | $172,000 | None Available | |
| Henfling Scott | $145,000 | None Available | |
| Harold | $14,000 | -- |
Source: Public Records
Mortgage History
| Date | Status | Borrower | Loan Amount |
|---|---|---|---|
| Open | Stratton Keith | $173,737 | |
| Previous Owner | Henfling Scott | $136,171 |
Source: Public Records
Tax History Compared to Growth
Tax History
| Year | Tax Paid | Tax Assessment Tax Assessment Total Assessment is a certain percentage of the fair market value that is determined by local assessors to be the total taxable value of land and additions on the property. | Land | Improvement |
|---|---|---|---|---|
| 2025 | $1,767 | $44,880 | $5,000 | $39,880 |
| 2024 | $1,686 | $44,880 | $5,000 | $39,880 |
| 2023 | $1,606 | $35,000 | $4,000 | $31,000 |
| 2022 | $1,231 | $35,000 | $4,000 | $31,000 |
| 2021 | $1,220 | $35,000 | $4,000 | $31,000 |
| 2020 | $1,519 | $33,100 | $5,200 | $27,900 |
| 2019 | $1,144 | $33,100 | $5,200 | $27,900 |
| 2018 | $1,169 | $33,100 | $5,200 | $27,900 |
| 2017 | $1,473 | $33,100 | $5,200 | $27,900 |
| 2016 | $1,403 | $33,100 | $5,200 | $27,900 |
| 2015 | $1,276 | $28,670 | $4,400 | $24,270 |
| 2014 | $1,285 | $28,670 | $4,400 | $24,270 |
Source: Public Records
Map
Nearby Homes
- 1104 Summit Ridge Dr
- 1103 Summit Ridge Trail
- 1101 Summit Ridge Trail
- 1103 Summit Ridge Dr
- 2311 S 20th St
- 1905 Glendale St
- 3.04 Lot 17 Cedar Ridge Estates Ph II
- 1401 S 31st St
- 1901 Marlanita Dr
- 1801 Sara Ann Cir
- 1600 S 30th St
- 1401 S 31 1 2 St
- 1700 Barnhill Rd
- 25 Enclave
- 1701 Barnhill Rd
- 1810 Linwood Dr
- 412 Magnolia Dr
- 3200 Red Oak Dr
- 12 Enclave
- 3202 Red Oak Dr
- 0 Christopher Dr
- 2506 Christopher Dr
- 2600 Christopher Dr
- 2504 Christopher Dr
- 2509 Christopher Dr
- 2601 Christopher Dr
- 2507 Christopher Dr
- 2603 Christopher Dr
- 2505 Christopher Dr
- 2604 Christopher Dr
- 2501 Erin Way
- 2501 Erin Way
- 2502 Christopher Dr
- 1007 Alexander Cir
- 2508 Alexander Cir
- 2600 Alexander Cir
- 2606 Christopher Dr
- 2506 Alexander Cir
- 2602 Alexander Cir
- 1005 Alexander Cir