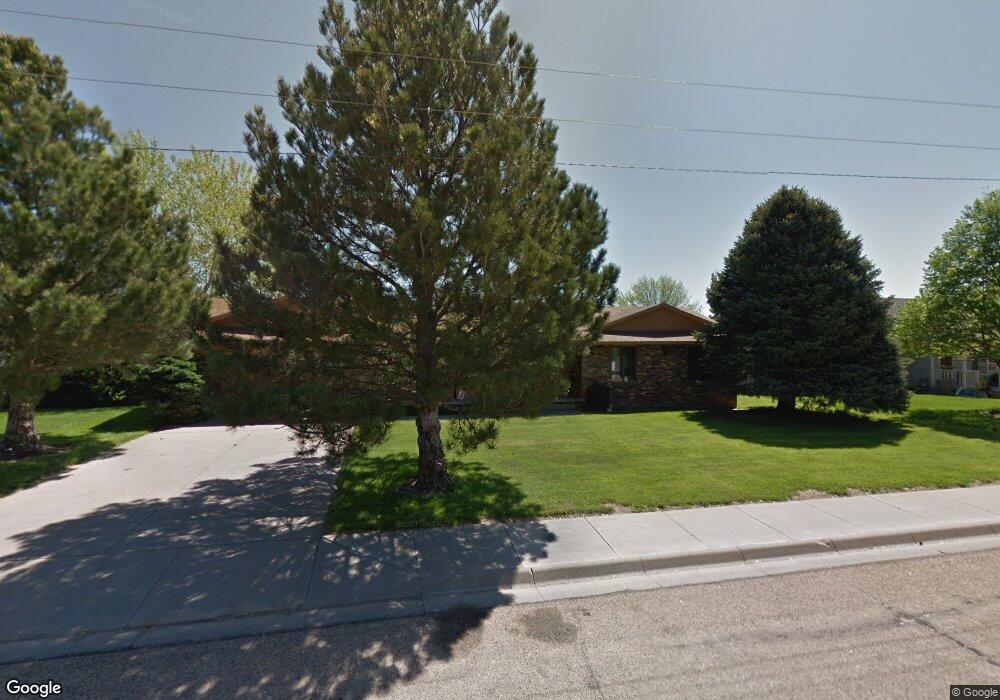
2508 N Coachman Dr Garden City, KS 67846
Estimated Value: $309,334 - $395,000
4
Beds
3
Baths
1,704
Sq Ft
$210/Sq Ft
Est. Value
About This Home
This home is located at 2508 N Coachman Dr, Garden City, KS 67846 and is currently estimated at $358,334, approximately $210 per square foot. 2508 N Coachman Dr is a home located in Finney County with nearby schools including Jennie Wilson Elementary School, Kenneth Henderson Middle School, and Charles O. Stones Intermediate Center.
Ownership History
Date
Name
Owned For
Owner Type
Purchase Details
Closed on
May 25, 2018
Sold by
Stewart Linda S
Bought by
Olomon Sallie J
Current Estimated Value
Home Financials for this Owner
Home Financials are based on the most recent Mortgage that was taken out on this home.
Original Mortgage
$188,000
Outstanding Balance
$137,227
Interest Rate
4.4%
Mortgage Type
Adjustable Rate Mortgage/ARM
Estimated Equity
$221,107
Purchase Details
Closed on
Oct 10, 2006
Sold by
Olomon Norma F and Olomon Charles P
Bought by
Revocable Trust Of Charles P Olomon Jr
Purchase Details
Closed on
May 26, 2006
Sold by
Andrews Erna B
Bought by
Stroufe Opal N and Glunt Betsy D
Home Financials for this Owner
Home Financials are based on the most recent Mortgage that was taken out on this home.
Original Mortgage
$163,415
Interest Rate
6.67%
Mortgage Type
Commercial
Create a Home Valuation Report for This Property
The Home Valuation Report is an in-depth analysis detailing your home's value as well as a comparison with similar homes in the area
Home Values in the Area
Average Home Value in this Area
Purchase History
| Date | Buyer | Sale Price | Title Company |
|---|---|---|---|
| Olomon Sallie J | -- | Security 1St Title | |
| Revocable Trust Of Charles P Olomon Jr | -- | None Available | |
| Stroufe Opal N | -- | None Available |
Source: Public Records
Mortgage History
| Date | Status | Borrower | Loan Amount |
|---|---|---|---|
| Open | Olomon Sallie J | $188,000 | |
| Previous Owner | Stroufe Opal N | $163,415 |
Source: Public Records
Tax History Compared to Growth
Tax History
| Year | Tax Paid | Tax Assessment Tax Assessment Total Assessment is a certain percentage of the fair market value that is determined by local assessors to be the total taxable value of land and additions on the property. | Land | Improvement |
|---|---|---|---|---|
| 2024 | $6,352 | $38,727 | $2,745 | $35,982 |
| 2023 | $6,352 | $35,747 | $2,745 | $33,002 |
| 2022 | $5,265 | $32,460 | $1,985 | $30,475 |
| 2021 | $4,959 | $30,267 | $1,985 | $28,282 |
| 2020 | $4,638 | $28,829 | $1,985 | $26,844 |
| 2019 | $4,393 | $27,820 | $1,985 | $25,835 |
| 2018 | $4,388 | $27,913 | $1,985 | $25,928 |
| 2017 | $4,114 | $0 | $0 | $0 |
| 2016 | $3,870 | $0 | $0 | $0 |
| 2015 | $3,819 | $0 | $0 | $0 |
| 2012 | -- | $0 | $0 | $0 |
Source: Public Records
Map
Nearby Homes
- 2504 N Carriage Ln
- 2505 N Carriage Ln
- 2617 N Coachman Ln
- 1101 E Mary St
- 2106 N Belmont Place Unit 4
- 2402 N Koster St
- 807 E Price St
- 1810 N Koster St
- 2008 N Antler Ridge Dr
- 2001 Bison Dr
- 2010 N Belmont Place
- 624 Briar Hill Dr
- 2065 Cottontail Ct
- 2075 Cottontail Ct
- 2090 Cottontail Ct
- 2055 Cottontail Ct
- 2085 Cottontail Ct
- 2095 Cottontail Ct
- 2060 Cottontail Ct
- 1517 E Johnson St
- 2508 N Coachman Ln
- 2506 N Coachman Dr
- 2512 N Coachman Ln
- 2512 N Coachman Dr
- 2407 Caseys Dr
- 2505 N Coachman Dr
- 2405 Caseys Dr
- 2502 N Coachman Ln
- 2507 N Coachman Dr
- 2411 Casey's Dr
- 2503 N Coachman Dr
- 2502 N Coachman Dr
- 2509 N Coachman Ln
- 2509 N Coachman Dr
- 1307 Kingsbury Rd
- 2403 Caseys Dr
- 2511 N Coachman Dr
- 2502 N Carriage Ln
- 1305 Kingsbury Rd
- 2513 N Coachman Dr