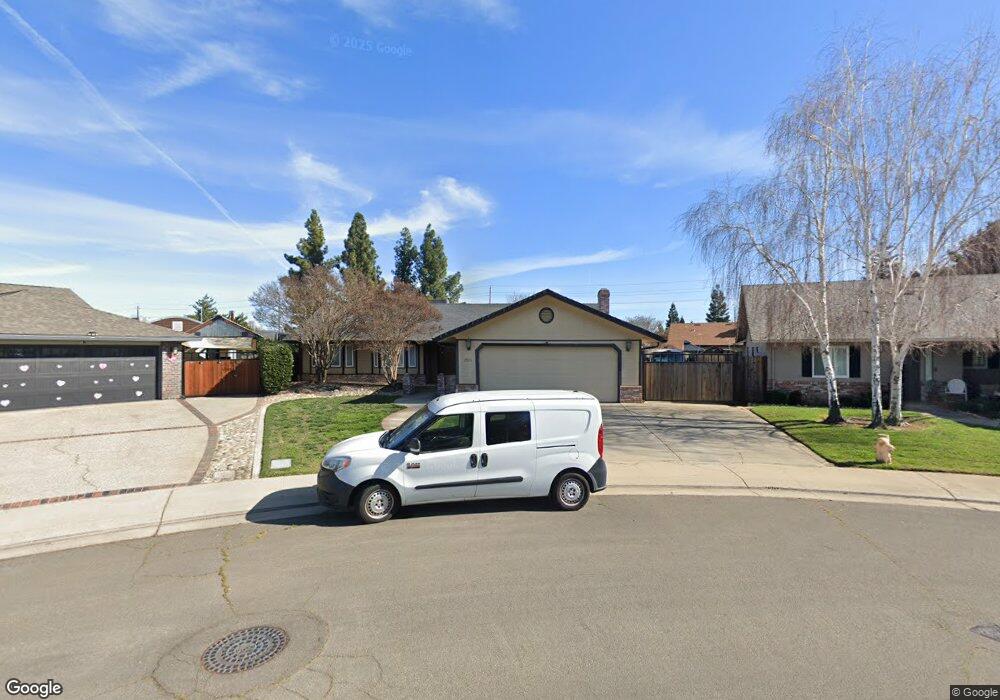
2523 Alder Glen Dr Lodi, CA 95242
Sunwest NeighborhoodEstimated Value: $512,101 - $584,000
3
Beds
2
Baths
1,739
Sq Ft
$324/Sq Ft
Est. Value
About This Home
This home is located at 2523 Alder Glen Dr, Lodi, CA 95242 and is currently estimated at $563,025, approximately $323 per square foot. 2523 Alder Glen Dr is a home located in San Joaquin County with nearby schools including Erma B. Reese Elementary School, Millswood Middle School, and Lodi High School.
Ownership History
Date
Name
Owned For
Owner Type
Purchase Details
Closed on
Jun 6, 2006
Sold by
Sandvik Erik B and Sandvik Andrea J
Bought by
Sandvik Erik B and Sandvik Andrea J
Current Estimated Value
Purchase Details
Closed on
Feb 1, 2002
Sold by
Kelland Ruth A and The Ruth A Kelland Trust
Bought by
Sandvik Erik B and Sandvik Andrea J
Home Financials for this Owner
Home Financials are based on the most recent Mortgage that was taken out on this home.
Original Mortgage
$141,560
Outstanding Balance
$58,906
Interest Rate
7.15%
Estimated Equity
$504,119
Purchase Details
Closed on
Dec 24, 1996
Sold by
Ruth Kelland and Hale Michey S
Bought by
The Ruth A Kelland Trust
Purchase Details
Closed on
Jun 23, 1995
Sold by
Teresi Frank A and Teresi Pamela G
Bought by
Kelland Ruth and Hale Mickey S
Create a Home Valuation Report for This Property
The Home Valuation Report is an in-depth analysis detailing your home's value as well as a comparison with similar homes in the area
Home Values in the Area
Average Home Value in this Area
Purchase History
| Date | Buyer | Sale Price | Title Company |
|---|---|---|---|
| Sandvik Erik B | -- | None Available | |
| Sandvik Erik B | $177,000 | Fidelity National Title Co | |
| The Ruth A Kelland Trust | -- | -- | |
| Kelland Ruth | $178,500 | Chicago Title Company |
Source: Public Records
Mortgage History
| Date | Status | Borrower | Loan Amount |
|---|---|---|---|
| Open | Sandvik Erik B | $141,560 |
Source: Public Records
Tax History Compared to Growth
Tax History
| Year | Tax Paid | Tax Assessment Tax Assessment Total Assessment is a certain percentage of the fair market value that is determined by local assessors to be the total taxable value of land and additions on the property. | Land | Improvement |
|---|---|---|---|---|
| 2025 | $2,767 | $261,390 | $73,857 | $187,533 |
| 2024 | $2,690 | $256,265 | $72,409 | $183,856 |
| 2023 | $2,657 | $251,241 | $70,990 | $180,251 |
| 2022 | $2,597 | $246,316 | $69,599 | $176,717 |
| 2021 | $2,642 | $241,487 | $68,235 | $173,252 |
| 2020 | $2,573 | $239,012 | $67,536 | $171,476 |
| 2019 | $2,519 | $234,326 | $66,212 | $168,114 |
| 2018 | $2,483 | $229,732 | $64,914 | $164,818 |
| 2017 | $2,426 | $225,229 | $63,642 | $161,587 |
| 2016 | $2,273 | $220,815 | $62,395 | $158,420 |
| 2014 | $2,216 | $213,239 | $60,254 | $152,985 |
Source: Public Records
Map
Nearby Homes
- 2526 Park West Dr
- 2633 Bayberry Dr
- 406 Whitney St
- 2408 Tejon St
- 2651 Douglas Fir Dr
- 208 Palomar Dr
- 2816 Applewood Dr
- 2161 W Elm St
- 2662 Veneto Ct
- 324 Applewood Dr
- 2670 Manza Ct
- 991 Harvest Crossing St
- 2107 Yosemite Dr
- 2937 Heritage Oak Way
- 2131 Jerry Ln
- 2438 Central Park Dr
- 2145 W Pine St
- 2355 Woodlake Cir
- 1111 Brighton Way
- 3021 Belmont Dr
- 2529 Alder Glen Dr
- 2517 Alder Glen Dr
- 301 N Lower Sacramento Rd
- 307 N Lower Sacramento Rd
- 221 N Lower Sacramento Rd
- 2535 Alder Glen Dr
- 2511 Alder Glen Dr
- 2508 Park West Dr
- 2514 Park West Dr
- 215 N Lower Sacramento Rd
- 315 N Lower Sacramento Rd
- 2520 Park West Dr
- 2541 Alder Glen Dr
- 2507 Alder Glen Dr
- 2538 Alder Glen Dr
- 207 N Lower Sacramento Rd
- 2526 Park Dr W
- 2544 Alder Glen Dr
- 2547 Alder Glen Dr
- 2511 Bayberry Dr