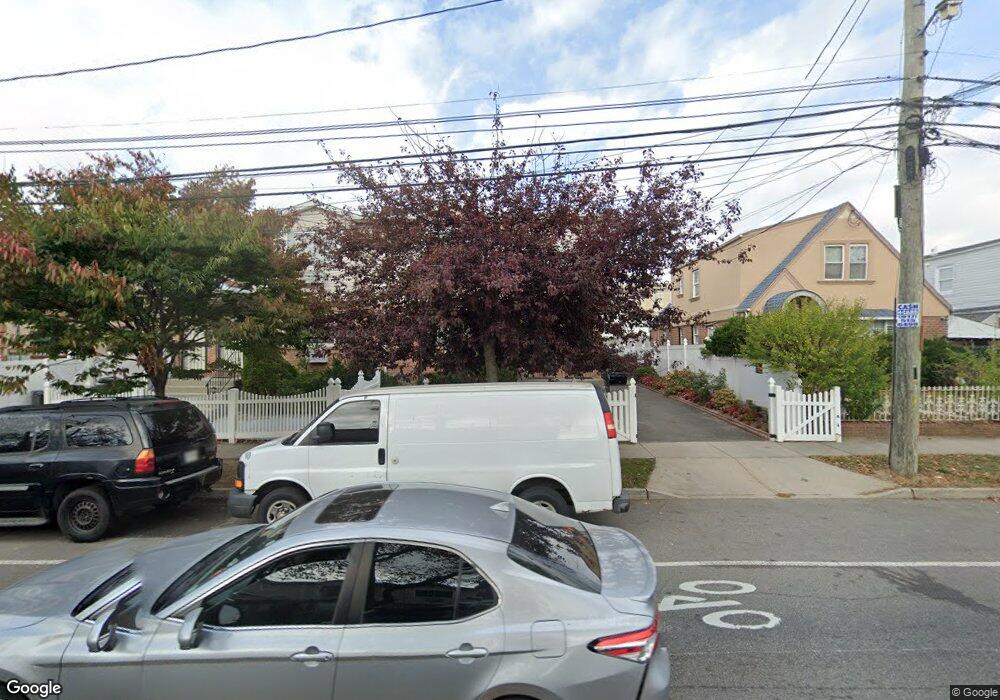
2524 Beach Channel Dr Far Rockaway, NY 11691
Far Rockaway NeighborhoodEstimated Value: $830,318 - $892,000
--
Bed
--
Bath
2,400
Sq Ft
$357/Sq Ft
Est. Value
About This Home
This home is located at 2524 Beach Channel Dr, Far Rockaway, NY 11691 and is currently estimated at $857,330, approximately $357 per square foot. 2524 Beach Channel Dr is a home located in Queens County with nearby schools including P.S. 43, Ms 53 Brian Piccolo, and Q319 Village Academy.
Ownership History
Date
Name
Owned For
Owner Type
Purchase Details
Closed on
Jan 24, 2020
Sold by
Ceballo Jose M and Ceballo Pedro A
Bought by
Ceballo Jose M and Ceballos Harddy
Current Estimated Value
Purchase Details
Closed on
May 10, 2007
Sold by
Ceballo Jose M
Bought by
Ceballo Jose M and Ceballo Pedro A
Purchase Details
Closed on
Jan 24, 2007
Sold by
Hannibal John and Hannibal Linda
Bought by
Ceballo Jose M
Home Financials for this Owner
Home Financials are based on the most recent Mortgage that was taken out on this home.
Original Mortgage
$87,000
Interest Rate
6.22%
Purchase Details
Closed on
Dec 17, 1999
Sold by
Rock Development Corp
Bought by
Hannibal John and Hannibal Linda
Home Financials for this Owner
Home Financials are based on the most recent Mortgage that was taken out on this home.
Original Mortgage
$256,852
Interest Rate
7.84%
Mortgage Type
FHA
Purchase Details
Closed on
May 3, 1999
Sold by
Wind Atlantis Management Corp
Bought by
Rock Development Corp
Create a Home Valuation Report for This Property
The Home Valuation Report is an in-depth analysis detailing your home's value as well as a comparison with similar homes in the area
Home Values in the Area
Average Home Value in this Area
Purchase History
| Date | Buyer | Sale Price | Title Company |
|---|---|---|---|
| Ceballo Jose M | $100,000 | -- | |
| Ceballo Jose M | -- | -- | |
| Ceballo Jose M | -- | -- | |
| Ceballo Jose M | $580,000 | -- | |
| Ceballo Jose M | $580,000 | -- | |
| Hannibal John | $259,000 | Lawyers Title Insurance Corp | |
| Hannibal John | $259,000 | Lawyers Title Insurance Corp | |
| Rock Development Corp | $62,500 | -- | |
| Rock Development Corp | $62,500 | -- |
Source: Public Records
Mortgage History
| Date | Status | Borrower | Loan Amount |
|---|---|---|---|
| Previous Owner | Ceballo Jose M | $87,000 | |
| Previous Owner | Ceballo Jose M | $464,000 | |
| Previous Owner | Hannibal John | $256,852 |
Source: Public Records
Tax History Compared to Growth
Tax History
| Year | Tax Paid | Tax Assessment Tax Assessment Total Assessment is a certain percentage of the fair market value that is determined by local assessors to be the total taxable value of land and additions on the property. | Land | Improvement |
|---|---|---|---|---|
| 2025 | $6,944 | $34,836 | $7,733 | $27,103 |
| 2024 | $6,944 | $34,572 | $8,580 | $25,992 |
| 2023 | $6,551 | $32,616 | $8,664 | $23,952 |
| 2022 | $6,143 | $45,540 | $12,240 | $33,300 |
| 2021 | $6,109 | $40,680 | $12,240 | $28,440 |
| 2020 | $6,145 | $34,980 | $12,240 | $22,740 |
| 2019 | $5,734 | $29,940 | $12,240 | $17,700 |
| 2018 | $5,243 | $27,180 | $9,511 | $17,669 |
| 2017 | $4,927 | $25,642 | $10,399 | $15,243 |
| 2016 | $4,526 | $25,642 | $10,399 | $15,243 |
| 2015 | $2,698 | $24,192 | $8,209 | $15,983 |
| 2014 | $2,698 | $24,010 | $9,559 | $14,451 |
Source: Public Records
Map
Nearby Homes
- 2918 Beach Channel Dr
- 2810 Brookhaven Ave
- 2409 Brookhaven Ave
- 2407 Brookhaven Ave
- 622 Bay 32 St
- 526 Grassmere Terrace
- 1011 Bay 24th St
- 29-64 Falcon Ave
- 514 Beach 32nd St
- 2360 Beach Channel Dr
- 2711 Deerfield Rd
- 665 Nasby Place
- 2412 Deerfield Rd
- 1046 Dickens St
- 1050 Dickens St
- 638 Grassmere Terrace
- 1051 Bay 32nd St
- 2248 New Haven Ave
- 3114 Healy Ave
- 1118 Bay 24th St
- 2528 Beach Channel Dr
- 2528 Beach Channel Dr Unit 2
- 2520 Beach Channel Dr
- 25-20 Beach Channel Dr
- 2530 Beach Channel Dr
- 2516 Beach Channel Dr
- 2532 Beach Channel Dr
- 2534 Beach Channel Dr
- 2512 Beach Channel Dr
- 2527 Oceancrest Blvd
- 2523 Oceancrest Blvd
- 2536 Beach Channel Dr
- 2521 Oceancrest Blvd
- 2510 Beach Channel Dr
- 2531 Oceancrest Blvd
- 2519 Oceancrest Blvd
- 2538 Beach Channel Dr
- 2538 Beach Channel Dr
- 25-47 Beach Channel Dr
- 2517 Oceancrest Blvd