Estimated Value: $276,000 - $277,000
3
Beds
2
Baths
1,579
Sq Ft
$175/Sq Ft
Est. Value
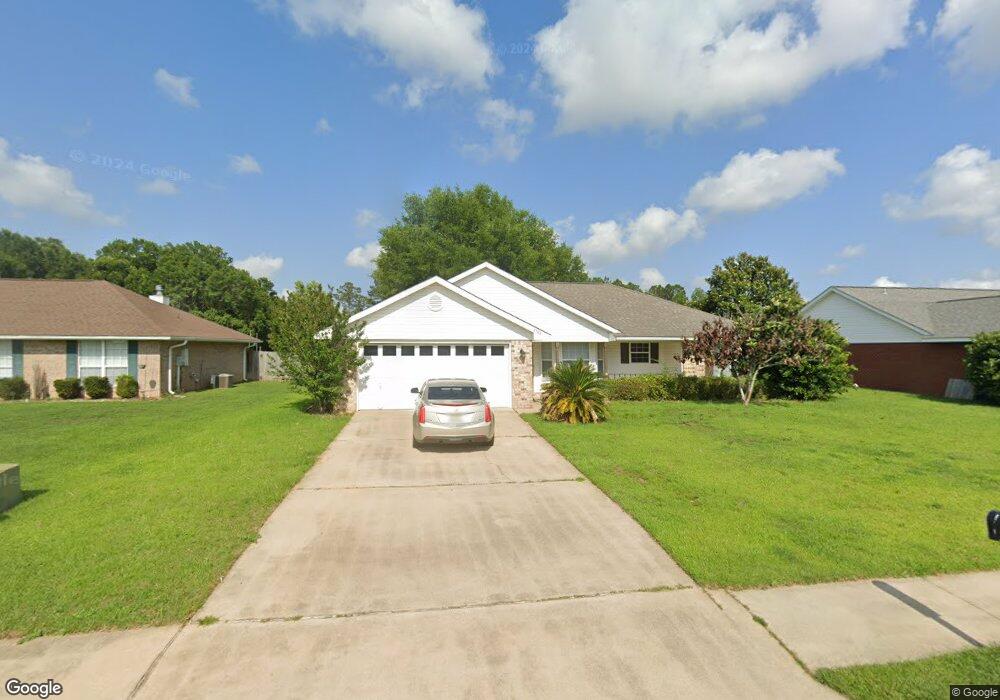
About This Home
This home is located at 2526 E Ashford Park Dr, Foley, AL 36535 and is currently estimated at $276,557, approximately $175 per square foot. 2526 E Ashford Park Dr is a home located in Baldwin County with nearby schools including Florence Mathis Elementary School, Foley Middle School, and Foley High School.
Ownership History
Date
Name
Owned For
Owner Type
Purchase Details
Closed on
Dec 27, 2019
Sold by
Prater Ronald C and Prater Jillie M
Bought by
Kranenberg Stephen Brrnard and Kranenberg Lucinda Michele
Current Estimated Value
Home Financials for this Owner
Home Financials are based on the most recent Mortgage that was taken out on this home.
Original Mortgage
$172,900
Outstanding Balance
$152,764
Interest Rate
3.6%
Mortgage Type
New Conventional
Estimated Equity
$123,793
Purchase Details
Closed on
Nov 20, 2015
Sold by
Ellisor Candice B and Ellisor Charles M
Bought by
Prater Ronald C and Prater Jillie M
Home Financials for this Owner
Home Financials are based on the most recent Mortgage that was taken out on this home.
Original Mortgage
$135,000
Interest Rate
3.87%
Mortgage Type
New Conventional
Purchase Details
Closed on
Aug 6, 2014
Sold by
Brokenshaw Deloris M
Bought by
Ellisor Candice B and Brokenshaw Hartly M
Create a Home Valuation Report for This Property
The Home Valuation Report is an in-depth analysis detailing your home's value as well as a comparison with similar homes in the area
Home Values in the Area
Average Home Value in this Area
Purchase History
| Date | Buyer | Sale Price | Title Company |
|---|---|---|---|
| Kranenberg Stephen Brrnard | $182,000 | None Available | |
| Prater Ronald C | -- | Professional Land Title Inc | |
| Ellisor Candice B | $114,500 | None Available |
Source: Public Records
Mortgage History
| Date | Status | Borrower | Loan Amount |
|---|---|---|---|
| Open | Kranenberg Stephen Brrnard | $172,900 | |
| Previous Owner | Prater Ronald C | $135,000 |
Source: Public Records
Tax History Compared to Growth
Tax History
| Year | Tax Paid | Tax Assessment Tax Assessment Total Assessment is a certain percentage of the fair market value that is determined by local assessors to be the total taxable value of land and additions on the property. | Land | Improvement |
|---|---|---|---|---|
| 2024 | $705 | $22,720 | $5,060 | $17,660 |
| 2023 | $668 | $21,600 | $4,920 | $16,680 |
| 2022 | $563 | $18,420 | $0 | $0 |
| 2021 | $513 | $16,560 | $0 | $0 |
| 2020 | $486 | $16,080 | $0 | $0 |
| 2019 | $494 | $16,320 | $0 | $0 |
| 2018 | $422 | $14,160 | $0 | $0 |
| 2017 | $404 | $13,600 | $0 | $0 |
| 2016 | $440 | $13,340 | $0 | $0 |
| 2015 | $417 | $12,640 | $0 | $0 |
| 2014 | $781 | $23,660 | $0 | $0 |
| 2013 | -- | $11,440 | $0 | $0 |
Source: Public Records
Map
Nearby Homes
- 2528 E Ashford Park Dr
- 547 Vestige Mews
- 450 Park Ave Unit 209
- 450 Park Ave Unit 112
- 450 Park Ave Unit 202
- 450 Park Ave Unit 305
- 450 Park Ave Unit 813
- 450 Park Ave Unit 812
- 450 Park Ave Unit 103
- 2701 Hampton Park Cir
- 554 Vestige Mews
- 2509 Crossford Dr
- 2006 Shelene Way Unit 22CR
- 8100 Highway 59
- 19184 County Road 20
- 19120 County Road 20
- 878 Connolly Ave
- 1043 Orlando Dr
- 1058 Tampa Ave
- 1052 Orlando Dr
- 2532 E Ashford Park Dr
- 2524 E Ashford Park Dr
- 2529 E Ashford Park Dr
- 2520 E Ashford Park Dr
- 2525 E Ashford Park Dr
- 2533 E Ashford Park Dr
- 2540 E Ashford Park Dr
- 2521 E Ashford Park Dr
- 2537 E Ashford Park Dr
- 2516 E Ashford Park Dr
- 2517 E Ashford Park Dr
- 2550 W Ashford Park Dr
- 2541 E Ashford Park Dr
- 2554 W Ashford Park Dr
- 2544 E Ashford Park Dr
- 2546 W Ashford Park Dr
- 2558 W Ashford Park Dr
- 2512 E Ashford Park Dr
- 2542 W Ashford Park Dr
- 2510 E Ashford Park Dr