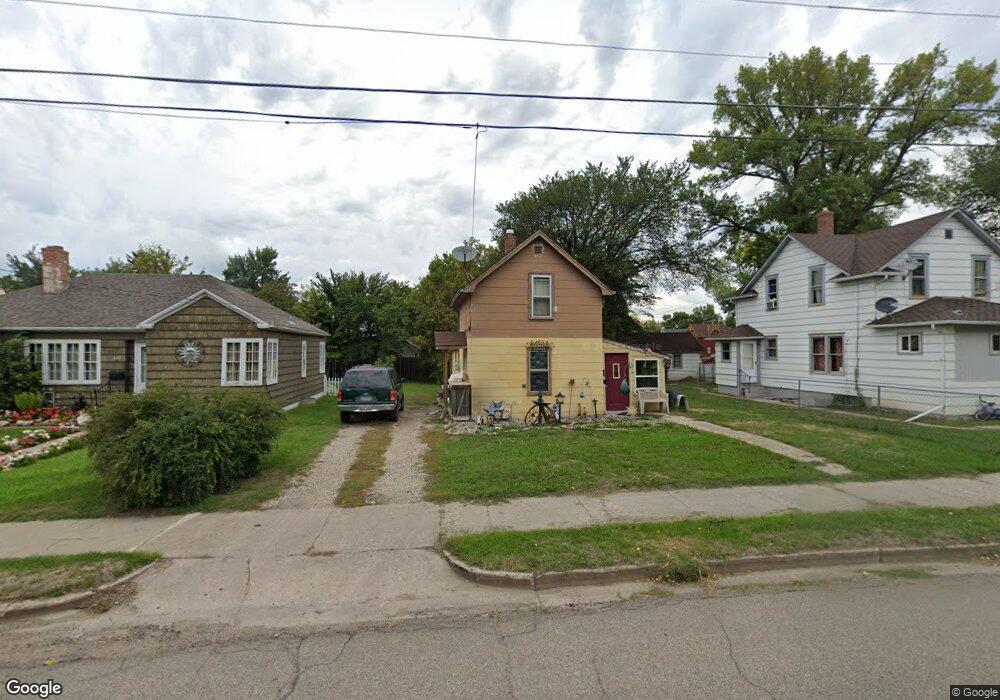
253 4th St SE Valley City, ND 58072
Estimated Value: $61,050 - $125,000
1
Bed
2
Baths
692
Sq Ft
$120/Sq Ft
Est. Value
About This Home
This home is located at 253 4th St SE, Valley City, ND 58072 and is currently estimated at $83,263, approximately $120 per square foot. 253 4th St SE is a home with nearby schools including Jefferson Elementary School, Washington Elementary School, and Valley City Junior High School.
Ownership History
Date
Name
Owned For
Owner Type
Purchase Details
Closed on
Feb 14, 2025
Sold by
Valley Bridges Properties Xii
Bought by
City Of Valley City
Current Estimated Value
Purchase Details
Closed on
Jun 30, 2021
Sold by
Bridge City Properties Ii Llc
Bought by
Valley Bridges Properties Xii Llc
Home Financials for this Owner
Home Financials are based on the most recent Mortgage that was taken out on this home.
Original Mortgage
$43,517
Interest Rate
2.9%
Mortgage Type
New Conventional
Purchase Details
Closed on
Nov 1, 2012
Sold by
Mohamedally Patricia R
Bought by
Nelson Donald A
Create a Home Valuation Report for This Property
The Home Valuation Report is an in-depth analysis detailing your home's value as well as a comparison with similar homes in the area
Home Values in the Area
Average Home Value in this Area
Purchase History
| Date | Buyer | Sale Price | Title Company |
|---|---|---|---|
| City Of Valley City | $77,003 | Barnes Title | |
| Valley Bridges Properties Xii Llc | -- | The Title Company | |
| Nelson Donald A | -- | None Available |
Source: Public Records
Mortgage History
| Date | Status | Borrower | Loan Amount |
|---|---|---|---|
| Previous Owner | Valley Bridges Properties Xii Llc | $43,517 |
Source: Public Records
Tax History Compared to Growth
Tax History
| Year | Tax Paid | Tax Assessment Tax Assessment Total Assessment is a certain percentage of the fair market value that is determined by local assessors to be the total taxable value of land and additions on the property. | Land | Improvement |
|---|---|---|---|---|
| 2024 | $532 | $17,750 | $5,100 | $12,650 |
| 2023 | $522 | $17,300 | $5,100 | $12,200 |
| 2022 | $492 | $16,100 | $4,450 | $11,650 |
| 2021 | $443 | $14,750 | $4,450 | $10,300 |
| 2020 | $449 | $14,750 | $4,450 | $10,300 |
| 2019 | $41,234 | $13,700 | $0 | $0 |
| 2018 | $407 | $13,650 | $0 | $0 |
| 2017 | $370 | $12,450 | $0 | $0 |
| 2016 | $336 | $12,450 | $0 | $0 |
| 2015 | $310 | $11,300 | $0 | $0 |
| 2014 | $22,939 | $8,100 | $1,900 | $6,200 |
| 2013 | $22,939 | $0 | $0 | $0 |
Source: Public Records
Map
Nearby Homes