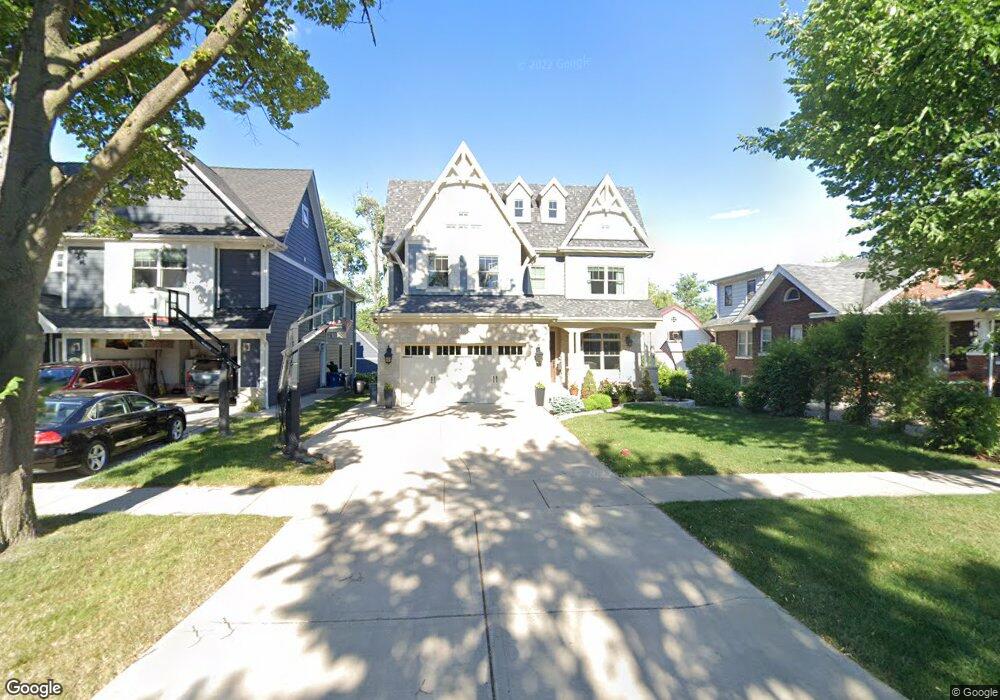
253 N Myrtle Ave Elmhurst, IL 60126
Estimated Value: $1,537,092 - $1,702,000
--
Bed
--
Bath
4,312
Sq Ft
$374/Sq Ft
Est. Value
About This Home
This home is located at 253 N Myrtle Ave, Elmhurst, IL 60126 and is currently estimated at $1,614,773, approximately $374 per square foot. 253 N Myrtle Ave is a home located in DuPage County with nearby schools including Reinberg Elementary School, Ruggles Elementary School, and Hawthorne Elementary School.
Ownership History
Date
Name
Owned For
Owner Type
Purchase Details
Closed on
Jul 23, 2015
Sold by
Mcgovern Builders Inc
Bought by
Wolbeck Matthew J and Wolbeck Marcie R
Current Estimated Value
Home Financials for this Owner
Home Financials are based on the most recent Mortgage that was taken out on this home.
Original Mortgage
$767,000
Interest Rate
3.87%
Mortgage Type
New Conventional
Purchase Details
Closed on
Jul 15, 2014
Sold by
Koenaman Karl N and Koenaman Judith A
Bought by
Mcgovern Builders Inc
Home Financials for this Owner
Home Financials are based on the most recent Mortgage that was taken out on this home.
Original Mortgage
$277,500
Interest Rate
6%
Mortgage Type
New Conventional
Purchase Details
Closed on
Sep 10, 2012
Sold by
Koeneman Karl N and Koeneman Judith A
Bought by
Koeneman Karl N and Koeneman Judith A
Create a Home Valuation Report for This Property
The Home Valuation Report is an in-depth analysis detailing your home's value as well as a comparison with similar homes in the area
Home Values in the Area
Average Home Value in this Area
Purchase History
| Date | Buyer | Sale Price | Title Company |
|---|---|---|---|
| Wolbeck Matthew J | $959,500 | First American Title Company | |
| Mcgovern Builders Inc | $225,000 | Git | |
| Koeneman Karl N | -- | None Available |
Source: Public Records
Mortgage History
| Date | Status | Borrower | Loan Amount |
|---|---|---|---|
| Previous Owner | Wolbeck Matthew J | $767,000 | |
| Previous Owner | Mcgovern Builders Inc | $277,500 |
Source: Public Records
Tax History Compared to Growth
Tax History
| Year | Tax Paid | Tax Assessment Tax Assessment Total Assessment is a certain percentage of the fair market value that is determined by local assessors to be the total taxable value of land and additions on the property. | Land | Improvement |
|---|---|---|---|---|
| 2024 | $26,782 | $452,404 | $88,080 | $364,324 |
| 2023 | $24,912 | $418,350 | $81,450 | $336,900 |
| 2022 | $27,214 | $454,790 | $78,300 | $376,490 |
| 2021 | $26,555 | $443,480 | $76,350 | $367,130 |
| 2020 | $25,542 | $433,770 | $74,680 | $359,090 |
| 2019 | $25,033 | $412,400 | $71,000 | $341,400 |
| 2018 | $21,694 | $356,180 | $67,210 | $288,970 |
| 2017 | $21,244 | $339,420 | $64,050 | $275,370 |
| 2016 | $20,828 | $319,760 | $60,340 | $259,420 |
| 2015 | $10,888 | $56,210 | $56,210 | $0 |
| 2014 | $4,460 | $57,870 | $44,620 | $13,250 |
| 2013 | $4,520 | $60,170 | $45,250 | $14,920 |
Source: Public Records
Map
Nearby Homes
- 196 N Walnut St
- 193 N Elm Ave
- 284 N Highland Ave
- 285 N Ridgeland Ave
- 407 W North Ave
- 104 Evergreen Ave
- 120 N Walnut St
- 322 N Highland Ave
- 254 N Addison Ave
- 262 N Addison Ave
- 258 N Addison Ave
- 260 N Addison Ave
- 210 N Addison Ave Unit 202
- 355 W 1st St
- 195 N Addison Ave Unit PH03
- 412 N Ridgeland Ave
- 442 N Oak St
- 456 N Elm Ave
- 131 W Adelaide St Unit 309
- 251 W Armitage Ave
- 249 N Myrtle Ave
- 257 N Myrtle Ave
- 259 N Myrtle Ave
- 243 N Myrtle Ave
- 261 N Myrtle Ave
- 248 N Evergreen Ave
- 244 N Evergreen Ave
- 250 N Evergreen Ave
- 256 N Evergreen Ave
- 237 N Myrtle Ave
- 267 N Myrtle Ave
- 252 N Myrtle Ave
- 238 N Evergreen Ave
- 256 N Myrtle Ave
- 234 N Evergreen Ave
- 260 N Evergreen Ave
- 250 N Myrtle Ave
- 262 N Myrtle Ave
- 248 N Myrtle Ave
- 269 N Myrtle Ave