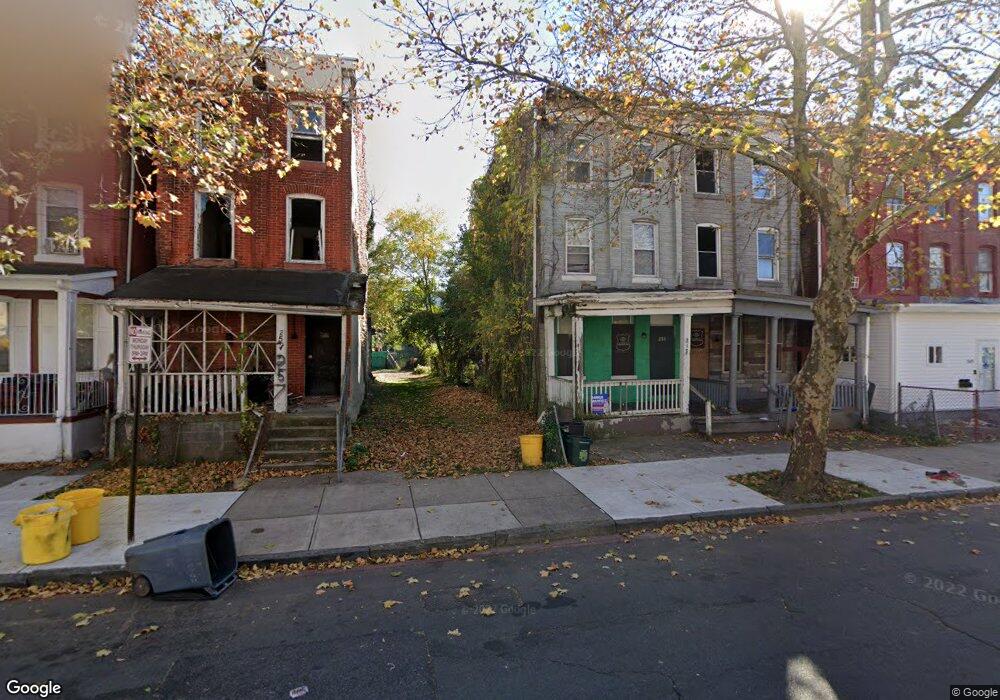
253 Walnut Ave Trenton, NJ 08609
Wilbur NeighborhoodEstimated Value: $77,185
4
Beds
1
Bath
1,540
Sq Ft
$50/Sq Ft
Est. Value
About This Home
This home is located at 253 Walnut Ave, Trenton, NJ 08609 and is currently estimated at $77,185, approximately $50 per square foot. 253 Walnut Ave is a home located in Mercer County with nearby schools including P.J. Hill Elementary School, Grant Elementary School, and Dr. Martin Luther King Middle School.
Ownership History
Date
Name
Owned For
Owner Type
Purchase Details
Closed on
Mar 8, 2010
Sold by
Steinberg Jacob
Bought by
Melloul Avraham
Current Estimated Value
Purchase Details
Closed on
Sep 4, 2009
Sold by
Ezri Properties Llc
Bought by
Steinberg Jacob
Purchase Details
Closed on
Mar 10, 2009
Sold by
Neighborhood Housing Services Of America
Bought by
Ezri Properties Llc
Purchase Details
Closed on
Dec 4, 2007
Sold by
Sheriff Of Mercer
Bought by
Neighborhood Housing Svcs Of A
Create a Home Valuation Report for This Property
The Home Valuation Report is an in-depth analysis detailing your home's value as well as a comparison with similar homes in the area
Home Values in the Area
Average Home Value in this Area
Purchase History
| Date | Buyer | Sale Price | Title Company |
|---|---|---|---|
| Melloul Avraham | $44,000 | Successful Title | |
| Steinberg Jacob | $16,500 | North American Title Agency | |
| Ezri Properties Llc | $12,000 | North American Title Agency | |
| Neighborhood Housing Svcs Of A | -- | -- |
Source: Public Records
Tax History Compared to Growth
Tax History
| Year | Tax Paid | Tax Assessment Tax Assessment Total Assessment is a certain percentage of the fair market value that is determined by local assessors to be the total taxable value of land and additions on the property. | Land | Improvement |
|---|---|---|---|---|
| 2025 | -- | $27,800 | $5,500 | $22,300 |
| 2024 | -- | $27,800 | $5,500 | $22,300 |
| 2023 | -- | $27,800 | $5,500 | $22,300 |
| 2022 | -- | $27,800 | $5,500 | $22,300 |
| 2021 | $1,544 | $27,800 | $5,500 | $22,300 |
| 2020 | $1,539 | $27,800 | $5,500 | $22,300 |
| 2019 | $1,514 | $27,800 | $5,500 | $22,300 |
| 2018 | $1,449 | $27,800 | $5,500 | $22,300 |
| 2017 | $1,377 | $27,800 | $5,500 | $22,300 |
| 2016 | $2,727 | $47,400 | $9,300 | $38,100 |
| 2015 | $2,717 | $47,400 | $9,300 | $38,100 |
| 2014 | $2,705 | $47,400 | $9,300 | $38,100 |
Source: Public Records
Map
Nearby Homes