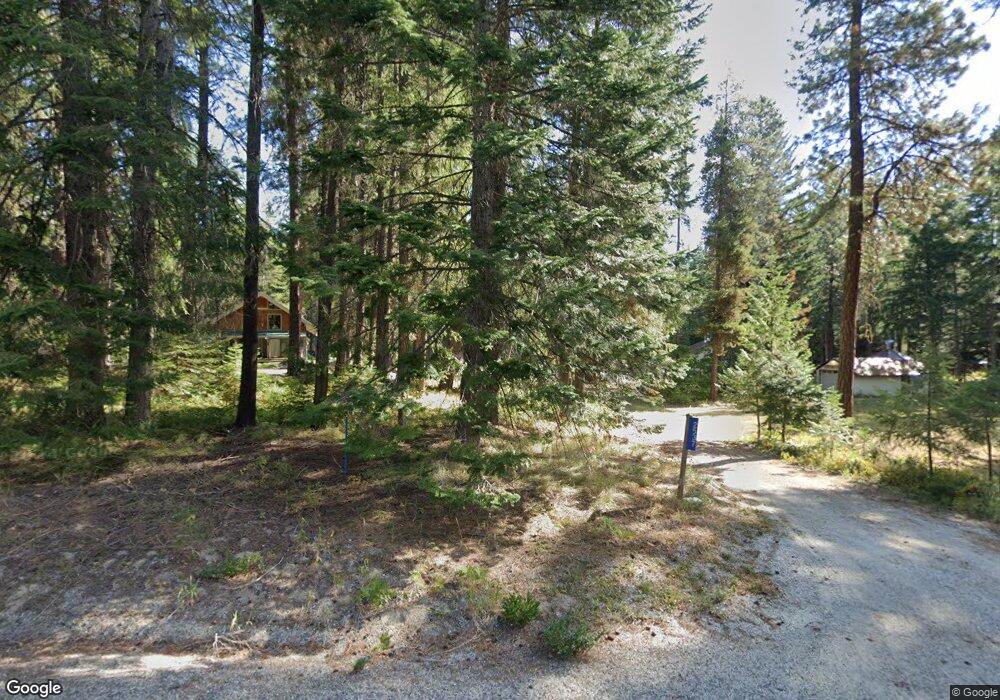
2536 Sumac Ln Leavenworth, WA 98826
Estimated Value: $684,019 - $787,000
1
Bed
2
Baths
1,008
Sq Ft
$722/Sq Ft
Est. Value
About This Home
This home is located at 2536 Sumac Ln, Leavenworth, WA 98826 and is currently estimated at $728,006, approximately $722 per square foot. 2536 Sumac Ln is a home located in Chelan County with nearby schools including Cascade High School.
Ownership History
Date
Name
Owned For
Owner Type
Purchase Details
Closed on
Nov 19, 2014
Sold by
Mauck Robert W and Mauck Kristi A
Bought by
Franks Tracy L
Current Estimated Value
Home Financials for this Owner
Home Financials are based on the most recent Mortgage that was taken out on this home.
Original Mortgage
$222,750
Outstanding Balance
$171,261
Interest Rate
4.1%
Mortgage Type
New Conventional
Estimated Equity
$556,745
Purchase Details
Closed on
Sep 23, 2009
Sold by
Renschler Michelle L and Renschler David J
Bought by
Mauck Robert W and Mauck Kristi A
Home Financials for this Owner
Home Financials are based on the most recent Mortgage that was taken out on this home.
Original Mortgage
$227,250
Interest Rate
5.08%
Mortgage Type
New Conventional
Purchase Details
Closed on
Jul 25, 2005
Sold by
Johnson Daniel B and Johnson Jody A
Bought by
Renschler Michelle L and Renschler David J
Home Financials for this Owner
Home Financials are based on the most recent Mortgage that was taken out on this home.
Original Mortgage
$256,800
Interest Rate
5.12%
Mortgage Type
Adjustable Rate Mortgage/ARM
Create a Home Valuation Report for This Property
The Home Valuation Report is an in-depth analysis detailing your home's value as well as a comparison with similar homes in the area
Home Values in the Area
Average Home Value in this Area
Purchase History
| Date | Buyer | Sale Price | Title Company |
|---|---|---|---|
| Franks Tracy L | $297,000 | First American Title | |
| Mauck Robert W | $303,000 | North Meridian Title & Escro | |
| Renschler Michelle L | $321,000 | First American Title Insuran |
Source: Public Records
Mortgage History
| Date | Status | Borrower | Loan Amount |
|---|---|---|---|
| Open | Franks Tracy L | $222,750 | |
| Previous Owner | Mauck Robert W | $227,250 | |
| Previous Owner | Renschler Michelle L | $256,800 |
Source: Public Records
Tax History Compared to Growth
Tax History
| Year | Tax Paid | Tax Assessment Tax Assessment Total Assessment is a certain percentage of the fair market value that is determined by local assessors to be the total taxable value of land and additions on the property. | Land | Improvement |
|---|---|---|---|---|
| 2021 | $4,087 | $437,371 | $132,986 | $304,385 |
| 2020 | $4,032 | $318,007 | $138,202 | $179,805 |
| 2019 | $3,662 | $405,321 | $141,246 | $264,075 |
| 2018 | $3,670 | $359,517 | $119,180 | $240,337 |
| 2017 | $2,901 | $331,927 | $122,873 | $209,054 |
| 2016 | $2,320 | $278,634 | $123,806 | $154,828 |
| 2015 | $2,320 | $255,974 | $131,924 | $124,050 |
| 2013 | $2,320 | $224,448 | $88,500 | $135,948 |
Source: Public Records
Map
Nearby Homes
- 2620 Wenatchee Pines
- 2677 Sumac Ln
- 2514 Kinnikinnick Dr
- 2628 Cottonwood Ln
- 2316 Pine Tree Rd
- 2205 Pine Tree Rd
- 2115 Chiwawa Ct
- 20106 Shugart Flats Rd
- 2233 Riffle Dr
- 2290 Riffle Dr
- 11190 Meadow Dr
- 19990 S Shugart Flats Rd
- 11411 Shugart Flats Rd
- 10919 Wending Ln
- 12360 W Shurgart Flats Rd
- 0 S Shugart Flats Rd
- 12469 W Shugart Flats Rd
- 19374 Westside Dr
- 19160 Westside Dr
- 18725 River Rd
- 2535 Sumac Ln
- 2532 Wenatchee Pines
- 2532 Wenatchee Pines Rd
- 2537 Sumac Ln
- 2530 Kinnikinnick Dr
- 2534 Sumac Ln
- 2549 Sumac Ln
- 2533 Sumac Ln
- 2548 Sumac Ln
- 2528 Kinnikinnick Dr
- 2601 Larch Dr
- 2683 Wenatchee Pines
- 0 Kinnikinnick Dr Unit NWM2060320
- 2539 Sumac Ln
- 2619 Larch Dr
- 2547 Sumac Ln
- 2602 Larch Dr
- 2587 Sumac Ln
- 2503 Kinnikinnick Dr