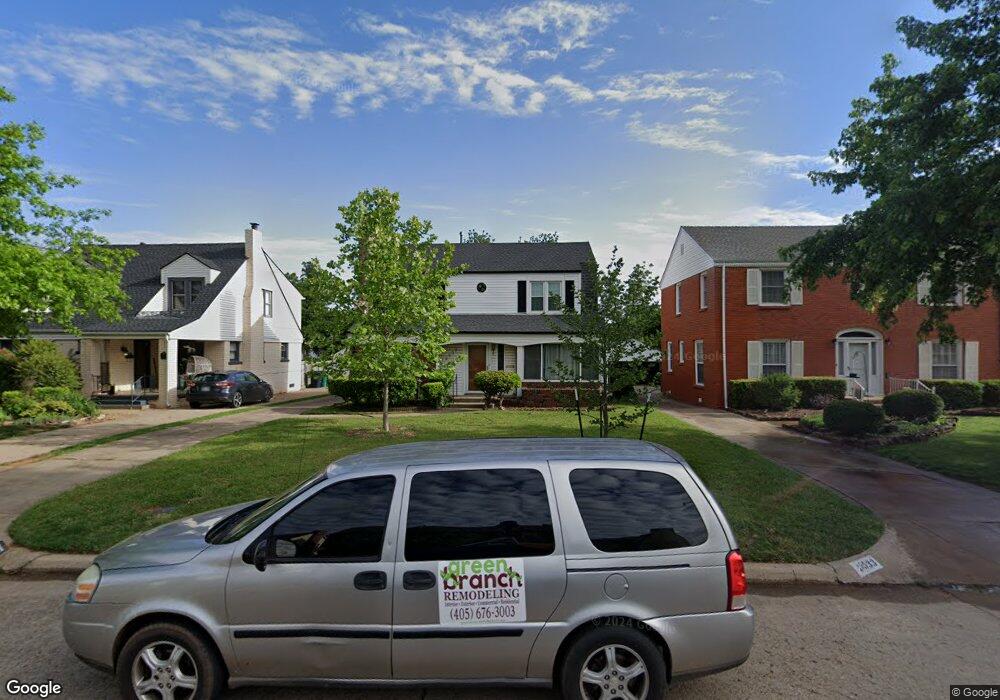
2537 NW 26th St Oklahoma City, OK 73107
Cleveland UCD NeighborhoodEstimated Value: $241,000 - $294,000
2
Beds
2
Baths
1,812
Sq Ft
$151/Sq Ft
Est. Value
About This Home
This home is located at 2537 NW 26th St, Oklahoma City, OK 73107 and is currently estimated at $273,868, approximately $151 per square foot. 2537 NW 26th St is a home located in Oklahoma County with nearby schools including Cleveland Elementary School, Taft Middle School, and Northwest Classen High School.
Ownership History
Date
Name
Owned For
Owner Type
Purchase Details
Closed on
Dec 18, 2023
Sold by
Lupi Darcy R and Lupi Charles R
Bought by
Darcy Lupi Trust and Lupi
Current Estimated Value
Purchase Details
Closed on
Apr 12, 2011
Sold by
Lupi Charles and Lupi Mary A
Bought by
Lupi Charles R and Lupi Mary A
Purchase Details
Closed on
Apr 7, 2004
Sold by
Denney Robert Michael and Denney Valentine
Bought by
Lupi Charles
Home Financials for this Owner
Home Financials are based on the most recent Mortgage that was taken out on this home.
Original Mortgage
$71,000
Interest Rate
5.38%
Mortgage Type
Purchase Money Mortgage
Purchase Details
Closed on
Feb 18, 2000
Sold by
Collier Jesse C and Finik Sherri Collier
Bought by
Denney Robert Michael and Denney Valentine
Home Financials for this Owner
Home Financials are based on the most recent Mortgage that was taken out on this home.
Original Mortgage
$67,014
Interest Rate
8.16%
Create a Home Valuation Report for This Property
The Home Valuation Report is an in-depth analysis detailing your home's value as well as a comparison with similar homes in the area
Home Values in the Area
Average Home Value in this Area
Purchase History
| Date | Buyer | Sale Price | Title Company |
|---|---|---|---|
| Darcy Lupi Trust | -- | None Listed On Document | |
| Lupi Charles R | -- | None Available | |
| Lupi Charles | $93,000 | Nations Title | |
| Denney Robert Michael | $73,000 | Lawyers Title |
Source: Public Records
Mortgage History
| Date | Status | Borrower | Loan Amount |
|---|---|---|---|
| Previous Owner | Lupi Charles | $71,000 | |
| Previous Owner | Denney Robert Michael | $67,014 |
Source: Public Records
Tax History Compared to Growth
Tax History
| Year | Tax Paid | Tax Assessment Tax Assessment Total Assessment is a certain percentage of the fair market value that is determined by local assessors to be the total taxable value of land and additions on the property. | Land | Improvement |
|---|---|---|---|---|
| 2024 | $2,543 | $21,742 | $2,482 | $19,260 |
| 2023 | $2,543 | $20,707 | $2,444 | $18,263 |
| 2022 | $2,320 | $19,720 | $2,818 | $16,902 |
| 2021 | $2,211 | $18,781 | $2,892 | $15,889 |
| 2020 | $2,130 | $17,887 | $3,555 | $14,332 |
| 2019 | $2,027 | $17,036 | $3,434 | $13,602 |
| 2018 | $1,841 | $16,225 | $0 | $0 |
| 2017 | $1,796 | $15,847 | $3,816 | $12,031 |
| 2016 | $1,712 | $15,092 | $3,214 | $11,878 |
| 2015 | $1,646 | $14,373 | $3,315 | $11,058 |
| 2014 | $1,560 | $13,706 | $3,315 | $10,391 |
Source: Public Records
Map
Nearby Homes
- 2532 NW 26th St
- 2533 NW 25th St
- 2536 NW 25th St
- 2640 NW 27th St
- 2648 NW 27th St
- 2647 NW 24th St
- 2617 NW 23rd St
- 2508 Cummings Dr
- 2720 NW 26th St
- 2560 NW 23rd St
- 3004 N Venice Blvd
- 2517 NW 22nd St
- 2509 NW 22nd St
- 2749 NW 22nd St
- 2329 NW 28th St
- 2533 NW 21st St
- 2428 NW 22nd St
- 2501 NW 21st St
- 2600 Cashion Place
- 2748 NW 22nd St
- 2541 NW 26th St
- 2533 NW 26th St
- 2545 NW 26th St
- 2529 NW 26th St
- 2536 NW 27th St
- 2532 NW 27th St
- 2540 NW 27th St
- 2525 NW 26th St
- 2544 NW 27th St
- 2528 NW 27th St
- 2536 NW 26th St
- 2540 NW 26th St
- 2521 NW 26th St
- 2524 NW 27th St
- 2601 NW 26th St
- 2544 NW 26th St
- 2528 NW 26th St
- 2524 NW 26th St
- 2520 NW 27th St
- 2600 NW 27th St