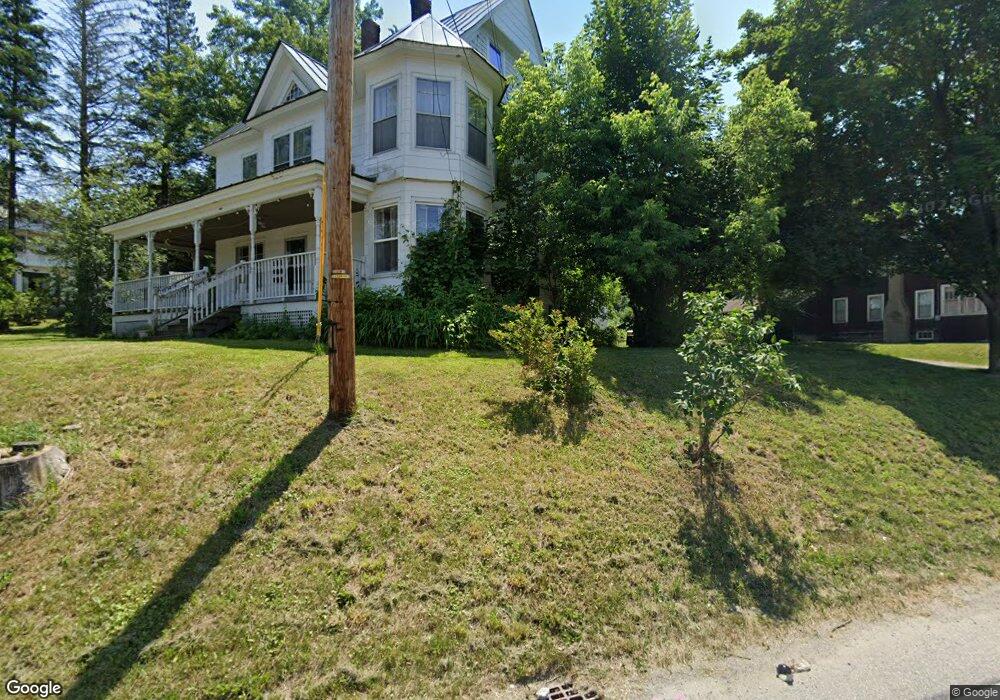
254 Pleasant St Claremont, NH 03743
South End NeighborhoodEstimated Value: $264,000 - $405,000
3
Beds
3
Baths
2,483
Sq Ft
$129/Sq Ft
Est. Value
About This Home
This home is located at 254 Pleasant St, Claremont, NH 03743 and is currently estimated at $319,667, approximately $128 per square foot. 254 Pleasant St is a home located in Sullivan County with nearby schools including Maple Avenue School, Claremont Middle School, and Stevens High School.
Ownership History
Date
Name
Owned For
Owner Type
Purchase Details
Closed on
Sep 9, 2020
Sold by
Sanborn Catherine A and Quicken Loans Llc
Bought by
Quicken Loans Llc
Current Estimated Value
Purchase Details
Closed on
Nov 6, 2015
Sold by
Bacon Brett E and Bacon Toni M
Bought by
Sanborn Chase and Sanborn Catherine A
Home Financials for this Owner
Home Financials are based on the most recent Mortgage that was taken out on this home.
Original Mortgage
$245,100
Interest Rate
3.88%
Mortgage Type
FHA
Create a Home Valuation Report for This Property
The Home Valuation Report is an in-depth analysis detailing your home's value as well as a comparison with similar homes in the area
Home Values in the Area
Average Home Value in this Area
Purchase History
| Date | Buyer | Sale Price | Title Company |
|---|---|---|---|
| Quicken Loans Llc | $79,570 | None Available | |
| Sanborn Chase | $96,000 | -- |
Source: Public Records
Mortgage History
| Date | Status | Borrower | Loan Amount |
|---|---|---|---|
| Previous Owner | Sanborn Chase | $245,100 |
Source: Public Records
Tax History Compared to Growth
Tax History
| Year | Tax Paid | Tax Assessment Tax Assessment Total Assessment is a certain percentage of the fair market value that is determined by local assessors to be the total taxable value of land and additions on the property. | Land | Improvement |
|---|---|---|---|---|
| 2024 | $6,297 | $215,200 | $25,000 | $190,200 |
| 2023 | $5,983 | $215,200 | $25,000 | $190,200 |
| 2022 | $4,768 | $114,400 | $16,100 | $98,300 |
| 2021 | $4,688 | $114,400 | $16,100 | $98,300 |
| 2020 | $4,658 | $114,400 | $16,100 | $98,300 |
| 2019 | $4,606 | $114,400 | $16,100 | $98,300 |
| 2018 | $5,390 | $128,100 | $16,100 | $112,000 |
| 2017 | $5,465 | $128,100 | $16,100 | $112,000 |
| 2016 | $5,460 | $128,100 | $16,100 | $112,000 |
| 2015 | $5,312 | $128,100 | $16,100 | $112,000 |
| 2014 | $5,294 | $128,100 | $16,100 | $112,000 |
| 2013 | $5,032 | $138,800 | $22,000 | $116,800 |
Source: Public Records
Map
Nearby Homes