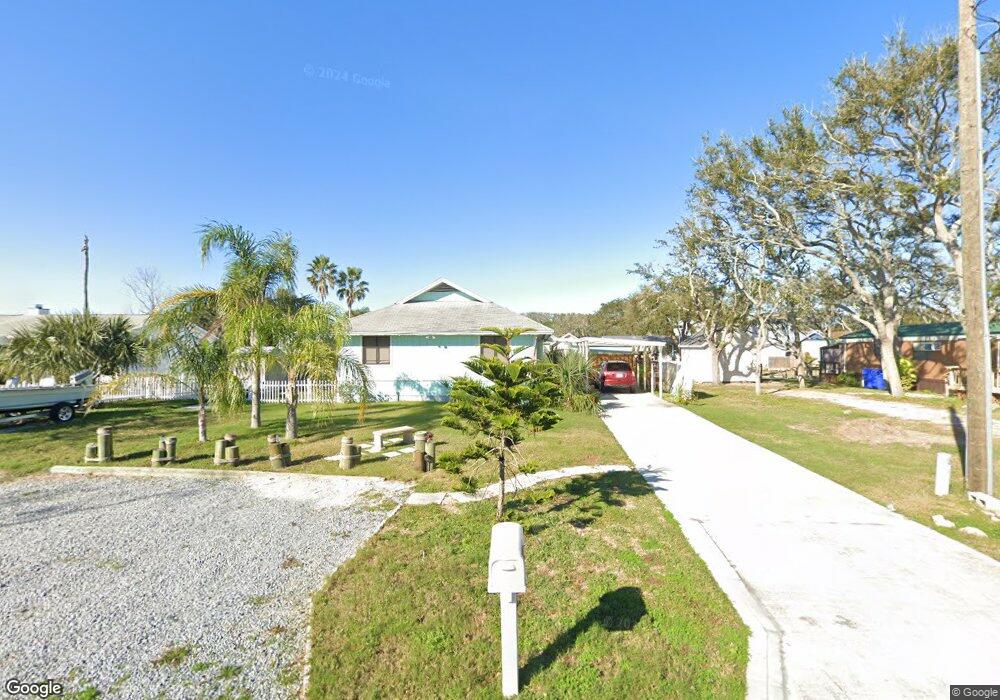
254 Ventura Saint Augustine Beach, FL
Butler and Crescent Beaches NeighborhoodEstimated Value: $403,000 - $508,000
2
Beds
2
Baths
1,080
Sq Ft
$421/Sq Ft
Est. Value
About This Home
This home is located at 254 Ventura, Saint Augustine Beach, FL and is currently estimated at $454,196, approximately $420 per square foot. 254 Ventura is a home located in St. Johns County with nearby schools including W. Douglas Hartley Elementary School, Gamble Rogers Middle School, and Pedro Menendez High School.
Ownership History
Date
Name
Owned For
Owner Type
Purchase Details
Closed on
Feb 8, 2013
Sold by
Langer William H and Langer Diane M
Bought by
Kronillis Jon S and Kronillis Kathy G
Current Estimated Value
Home Financials for this Owner
Home Financials are based on the most recent Mortgage that was taken out on this home.
Original Mortgage
$146,672
Outstanding Balance
$102,390
Interest Rate
3.38%
Mortgage Type
FHA
Estimated Equity
$351,807
Purchase Details
Closed on
Feb 3, 2006
Sold by
Bayer Jeffrey Alan
Bought by
Langer William H and Langer Diane M
Home Financials for this Owner
Home Financials are based on the most recent Mortgage that was taken out on this home.
Original Mortgage
$296,000
Interest Rate
6.14%
Mortgage Type
Fannie Mae Freddie Mac
Purchase Details
Closed on
Aug 30, 2001
Sold by
Bayer Richard
Bought by
Bayer Jeffrey Alan and Bayer Howard Paul
Create a Home Valuation Report for This Property
The Home Valuation Report is an in-depth analysis detailing your home's value as well as a comparison with similar homes in the area
Home Values in the Area
Average Home Value in this Area
Purchase History
| Date | Buyer | Sale Price | Title Company |
|---|---|---|---|
| Kronillis Jon S | $148,400 | Attorney | |
| Langer William H | $370,000 | Olde Towne Title & Escrow | |
| Bayer Jeffrey Alan | -- | -- |
Source: Public Records
Mortgage History
| Date | Status | Borrower | Loan Amount |
|---|---|---|---|
| Open | Kronillis Jon S | $146,672 | |
| Previous Owner | Langer William H | $296,000 |
Source: Public Records
Tax History Compared to Growth
Tax History
| Year | Tax Paid | Tax Assessment Tax Assessment Total Assessment is a certain percentage of the fair market value that is determined by local assessors to be the total taxable value of land and additions on the property. | Land | Improvement |
|---|---|---|---|---|
| 2025 | $2,397 | $168,954 | -- | -- |
| 2024 | $2,397 | $164,192 | -- | -- |
| 2023 | $2,397 | $159,410 | $0 | $0 |
| 2022 | $2,348 | $154,767 | $0 | $0 |
| 2021 | $2,361 | $150,259 | $0 | $0 |
| 2020 | $2,352 | $148,184 | $0 | $0 |
| 2019 | $2,373 | $144,852 | $0 | $0 |
| 2018 | $2,346 | $142,151 | $0 | $0 |
| 2017 | $2,336 | $139,227 | $0 | $0 |
| 2016 | $2,332 | $140,454 | $0 | $0 |
| 2015 | $2,345 | $133,329 | $0 | $0 |
| 2014 | $2,854 | $124,013 | $0 | $0 |
Source: Public Records
Map
Nearby Homes