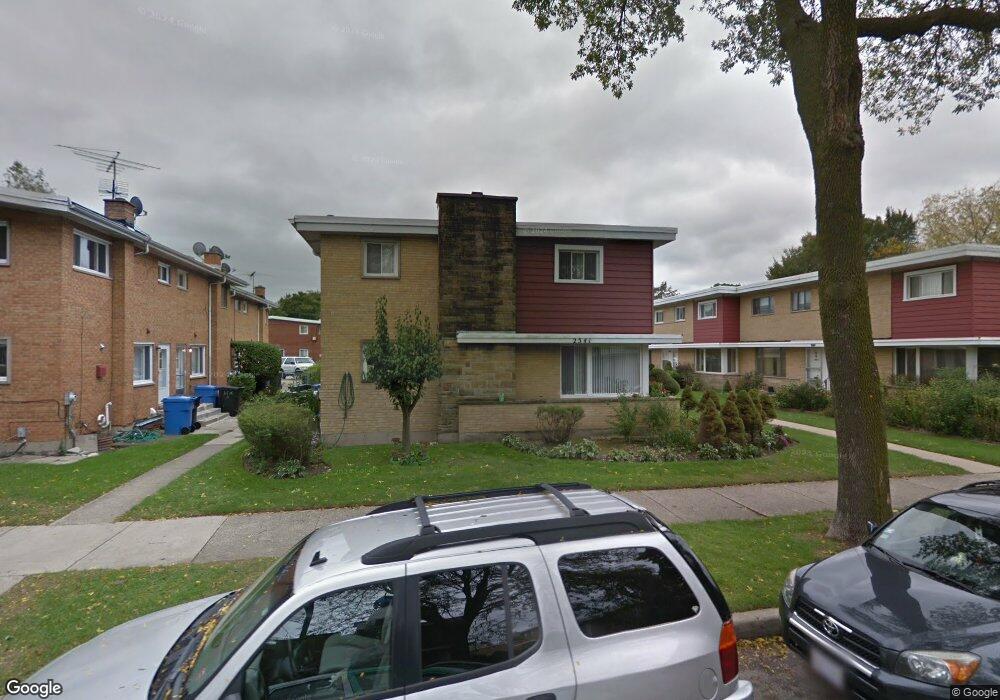
2541 W Jerome St Chicago, IL 60645
West Ridge NeighborhoodEstimated Value: $316,000 - $403,000
3
Beds
2
Baths
1,280
Sq Ft
$276/Sq Ft
Est. Value
About This Home
This home is located at 2541 W Jerome St, Chicago, IL 60645 and is currently estimated at $353,520, approximately $276 per square foot. 2541 W Jerome St is a home located in Cook County with nearby schools including Rogers Elementary School, Mather High School, and Acero - Sor Juana Ines de la Cruz School.
Ownership History
Date
Name
Owned For
Owner Type
Purchase Details
Closed on
Sep 30, 2009
Sold by
Arrigoni James
Bought by
Arrigoni James and Cancilla Cassandre
Current Estimated Value
Purchase Details
Closed on
Jan 15, 2009
Sold by
Arrigoni James and Cancilla Cassandre
Bought by
Arrigoni James
Home Financials for this Owner
Home Financials are based on the most recent Mortgage that was taken out on this home.
Original Mortgage
$303,215
Outstanding Balance
$194,303
Interest Rate
5.44%
Mortgage Type
FHA
Estimated Equity
$159,217
Purchase Details
Closed on
Jun 8, 2007
Sold by
Yousif Immanual K and Yousif Majda
Bought by
Arrigoni James and Cancilla Cassandre
Home Financials for this Owner
Home Financials are based on the most recent Mortgage that was taken out on this home.
Original Mortgage
$225,000
Interest Rate
6.2%
Mortgage Type
Unknown
Create a Home Valuation Report for This Property
The Home Valuation Report is an in-depth analysis detailing your home's value as well as a comparison with similar homes in the area
Home Values in the Area
Average Home Value in this Area
Purchase History
| Date | Buyer | Sale Price | Title Company |
|---|---|---|---|
| Arrigoni James | -- | Accommodation | |
| Arrigoni James | -- | Cst | |
| Arrigoni James | $300,000 | Pntn |
Source: Public Records
Mortgage History
| Date | Status | Borrower | Loan Amount |
|---|---|---|---|
| Open | Arrigoni James | $303,215 | |
| Closed | Arrigoni James | $225,000 |
Source: Public Records
Tax History Compared to Growth
Tax History
| Year | Tax Paid | Tax Assessment Tax Assessment Total Assessment is a certain percentage of the fair market value that is determined by local assessors to be the total taxable value of land and additions on the property. | Land | Improvement |
|---|---|---|---|---|
| 2024 | $4,364 | $25,000 | $3,105 | $21,895 |
| 2023 | $4,233 | $24,000 | $2,484 | $21,516 |
| 2022 | $4,233 | $24,000 | $2,484 | $21,516 |
| 2021 | $4,156 | $24,000 | $2,484 | $21,516 |
| 2020 | $3,695 | $19,690 | $1,800 | $17,890 |
| 2019 | $3,702 | $21,854 | $1,800 | $20,054 |
| 2018 | $3,638 | $21,854 | $1,800 | $20,054 |
| 2017 | $2,614 | $15,520 | $1,614 | $13,906 |
| 2016 | $2,608 | $15,520 | $1,614 | $13,906 |
| 2015 | $2,363 | $15,520 | $1,614 | $13,906 |
| 2014 | $2,312 | $15,032 | $1,490 | $13,542 |
| 2013 | $2,256 | $15,032 | $1,490 | $13,542 |
Source: Public Records
Map
Nearby Homes
- 1615 W Howard St Unit 303
- 2522 W Jarvis Ave
- 7433 N Washtenaw Ave
- 1406 Brummel St
- 7546 N Oakley Ave
- 2256 W Birchwood Ave
- 309 Darrow Ave
- 215 Brown Ave
- 7315 N Oakley Ave Unit 1A
- 2650 W Touhy Ave
- 2011 Brummel St
- 7540 N Ridge Blvd Unit 5C
- 7540 N Ridge Blvd Unit 5D
- 347 Florence Ave
- 7348 N Ridge Blvd Unit 16B
- 7344 N Ridge Blvd Unit 5C
- 200 Ridge Ave Unit 2C
- 7252 N Bell Ave
- 7223 N Oakley Ave Unit 1E
- 401 Dewey Ave
- 2541 W Jerome St
- 2541 W Jerome St
- 2541 W Jerome St
- 2541 W Jerome St Unit B
- 2547 W Jerome St
- 2547 W Jerome St
- 2547 W Jerome St
- 2547 W Jerome St
- 2547 W Jerome St Unit D
- 2535 W Jerome St
- 2535 W Jerome St
- 2535 W Jerome St
- 2535 W Jerome St
- 2535 W Jerome St Unit A
- 2535 W Jerome St Unit B
- 2538 W Birchwood Ave
- 2538 W Birchwood Ave
- 2538 W Birchwood Ave
- 2532 W Birchwood Ave Unit B
- 2532 W Birchwood Ave