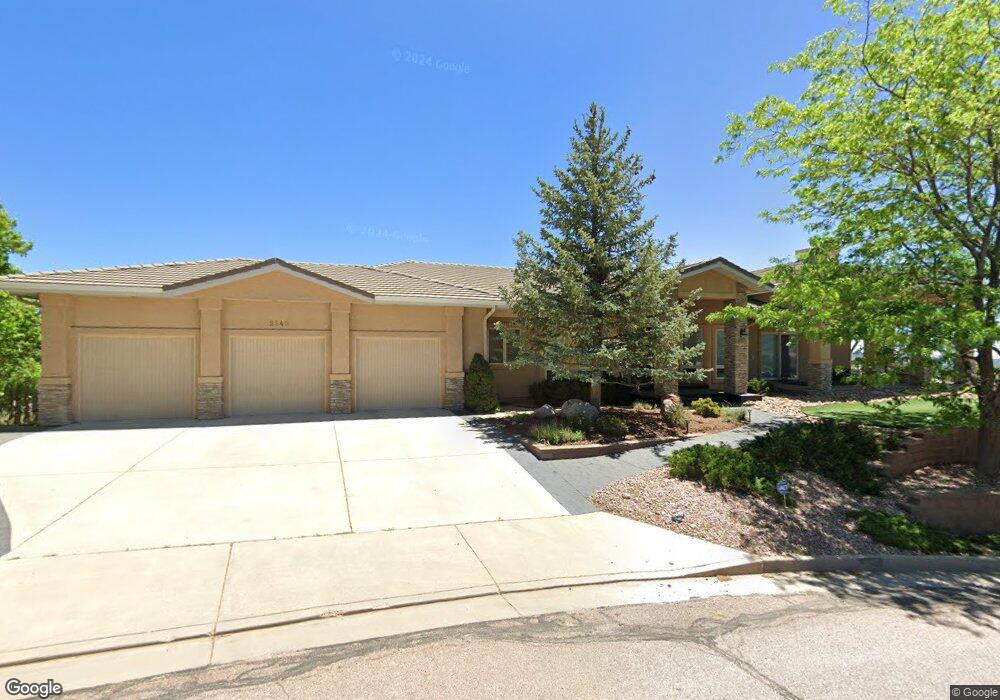
2545 Oak Hills Dr Colorado Springs, CO 80919
Oak Hills NeighborhoodEstimated Value: $1,199,000 - $1,292,000
4
Beds
4
Baths
2,981
Sq Ft
$422/Sq Ft
Est. Value
About This Home
This home is located at 2545 Oak Hills Dr, Colorado Springs, CO 80919 and is currently estimated at $1,258,863, approximately $422 per square foot. 2545 Oak Hills Dr is a home located in El Paso County with nearby schools including Foothills Elementary School, Eagleview Middle School, and Air Academy High School.
Ownership History
Date
Name
Owned For
Owner Type
Purchase Details
Closed on
Aug 5, 2015
Sold by
Frohling Lon P and Frohling Martha H
Bought by
Olson Kirk Michael and Olson Courtney Laine
Current Estimated Value
Home Financials for this Owner
Home Financials are based on the most recent Mortgage that was taken out on this home.
Original Mortgage
$737,625
Outstanding Balance
$580,729
Interest Rate
4.06%
Mortgage Type
VA
Estimated Equity
$678,134
Purchase Details
Closed on
Feb 11, 2000
Sold by
Frohling Family Partnership No 2 Ltd
Bought by
Frohling Lon P and Frohling Martha H
Home Financials for this Owner
Home Financials are based on the most recent Mortgage that was taken out on this home.
Original Mortgage
$250,000
Interest Rate
8.16%
Purchase Details
Closed on
Jan 24, 1989
Bought by
Olson Kirk Michael
Purchase Details
Closed on
Aug 1, 1988
Bought by
Olson Courtney Laine
Create a Home Valuation Report for This Property
The Home Valuation Report is an in-depth analysis detailing your home's value as well as a comparison with similar homes in the area
Home Values in the Area
Average Home Value in this Area
Purchase History
| Date | Buyer | Sale Price | Title Company |
|---|---|---|---|
| Olson Kirk Michael | $844,500 | North American Title | |
| Frohling Lon P | -- | -- | |
| Olson Kirk Michael | -- | -- | |
| Olson Courtney Laine | -- | -- |
Source: Public Records
Mortgage History
| Date | Status | Borrower | Loan Amount |
|---|---|---|---|
| Open | Olson Kirk Michael | $737,625 | |
| Previous Owner | Frohling Lon P | $250,000 |
Source: Public Records
Tax History Compared to Growth
Tax History
| Year | Tax Paid | Tax Assessment Tax Assessment Total Assessment is a certain percentage of the fair market value that is determined by local assessors to be the total taxable value of land and additions on the property. | Land | Improvement |
|---|---|---|---|---|
| 2025 | $4,338 | $77,830 | -- | -- |
| 2024 | $4,374 | $75,710 | $13,510 | $62,200 |
| 2023 | $4,374 | $75,710 | $13,510 | $62,200 |
| 2022 | $4,751 | $71,800 | $11,440 | $60,360 |
| 2021 | $5,279 | $73,870 | $11,770 | $62,100 |
| 2020 | $4,785 | $62,150 | $9,850 | $52,300 |
| 2019 | $4,734 | $62,150 | $9,850 | $52,300 |
| 2018 | $4,567 | $58,930 | $9,550 | $49,380 |
| 2017 | $4,550 | $58,930 | $9,550 | $49,380 |
| 2016 | $4,469 | $57,800 | $10,030 | $47,770 |
| 2015 | $3,846 | $57,800 | $10,030 | $47,770 |
| 2014 | $3,596 | $54,530 | $8,420 | $46,110 |
Source: Public Records
Map
Nearby Homes
- 7137 Oak Valley Dr Unit 28
- 7137 Oak Valley Dr
- 1935 Anasazi Ct
- 2044 Bristlecone Dr
- 7074 Oak Valley Dr
- 7049 Oak Valley Dr
- 2130 Alicia Point Unit 101
- 1595 Oak Hills Dr
- 2112 Denton Grove Unit 101
- 2122 Denton Grove Unit 103
- 2117 Denton Grove Unit 201
- 1240 Oak Hills Dr
- 6825 Oak Valley Ln
- 7020 Native Cir
- 2245 Split Rock Dr
- 7315 Wynwood Terrace
- 1915 Hunters Point Ln
- 6540 White Falcon Ct
- 2269 Silent Rain Dr
- 1935 Chateau Point Ct
- 2535 Oak Hills Dr
- 2540 Oak Hills Dr
- 2550 Oak Hills Dr
- 2525 Oak Hills Dr
- 6874 Oak Valley Dr
- 6860 Oak Valley Dr
- 6850 Oak Valley Dr
- 2530 Oak Hills Dr
- 6858 Oak Valley Dr
- 2580 Oak Hills Dr
- 6914 Oak Valley Dr
- 6854 Oak Valley Dr
- 2560 Oak Hills Dr
- 2570 Oak Hills Dr
- 2515 Oak Hills Dr
- 6926 Oak Valley Dr
- 6930 Oak Valley Dr
- 2520 Oak Hills Dr
- 6950 Oak Valley Dr
- 6881 Oak Valley Dr