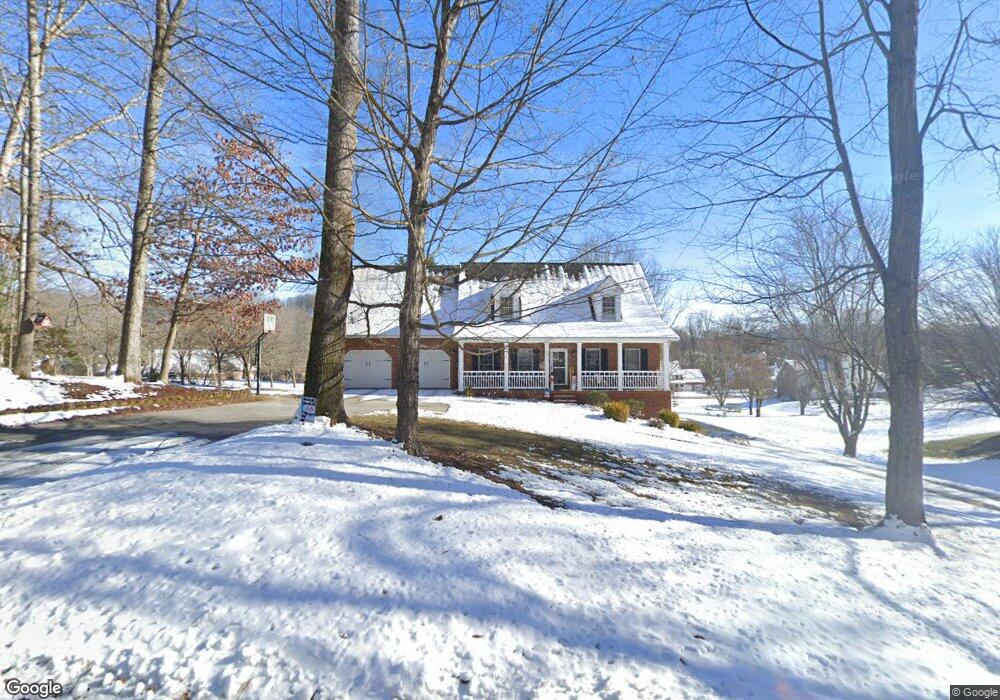
255 Old Cooks Valley Rd Kingsport, TN 37664
Estimated Value: $448,102 - $573,000
3
Beds
3
Baths
2,511
Sq Ft
$209/Sq Ft
Est. Value
About This Home
This home is located at 255 Old Cooks Valley Rd, Kingsport, TN 37664 and is currently estimated at $525,026, approximately $209 per square foot. 255 Old Cooks Valley Rd is a home located in Sullivan County with nearby schools including Andrew Johnson Elementary School, Ross N. Robinson Middle School, and Dobyns-Bennett High School.
Ownership History
Date
Name
Owned For
Owner Type
Purchase Details
Closed on
Jun 6, 2024
Sold by
Roller Ronnie Lynn and Roller Shenia Leigh
Bought by
Ronnie Lynn Roller And Shenia Leigh Roller Jo and Roller
Current Estimated Value
Purchase Details
Closed on
Jul 20, 2011
Home Financials for this Owner
Home Financials are based on the most recent Mortgage that was taken out on this home.
Original Mortgage
$110,000
Interest Rate
4.3%
Mortgage Type
Commercial
Purchase Details
Closed on
May 8, 2001
Purchase Details
Closed on
Oct 30, 1997
Sold by
Kyle Cross and Kyle Celine
Bought by
Douglas Edwards
Home Financials for this Owner
Home Financials are based on the most recent Mortgage that was taken out on this home.
Original Mortgage
$172,000
Interest Rate
7.31%
Purchase Details
Closed on
Oct 3, 1996
Sold by
Toohey Mark H and Toohey Connie H
Bought by
Kyle Cross
Create a Home Valuation Report for This Property
The Home Valuation Report is an in-depth analysis detailing your home's value as well as a comparison with similar homes in the area
Home Values in the Area
Average Home Value in this Area
Purchase History
| Date | Buyer | Sale Price | Title Company |
|---|---|---|---|
| Ronnie Lynn Roller And Shenia Leigh Roller Jo | -- | None Listed On Document | |
| -- | $251,000 | -- | |
| Roller Ronnie Lynn | $251,500 | -- | |
| -- | $215,000 | -- | |
| Douglas Edwards | $215,000 | -- | |
| Kyle Cross | $30,000 | -- |
Source: Public Records
Mortgage History
| Date | Status | Borrower | Loan Amount |
|---|---|---|---|
| Previous Owner | Roller Ronnie Lynn | $110,000 | |
| Previous Owner | Kyle Cross | $172,000 |
Source: Public Records
Tax History Compared to Growth
Tax History
| Year | Tax Paid | Tax Assessment Tax Assessment Total Assessment is a certain percentage of the fair market value that is determined by local assessors to be the total taxable value of land and additions on the property. | Land | Improvement |
|---|---|---|---|---|
| 2024 | -- | $69,575 | $7,150 | $62,425 |
| 2023 | $3,064 | $69,575 | $7,150 | $62,425 |
| 2022 | $3,064 | $69,575 | $7,150 | $62,425 |
| 2021 | $2,981 | $69,575 | $7,150 | $62,425 |
| 2020 | $1,653 | $69,575 | $7,150 | $62,425 |
| 2019 | $2,981 | $64,325 | $7,150 | $57,175 |
| 2018 | $2,910 | $64,325 | $7,150 | $57,175 |
| 2017 | $2,910 | $64,325 | $7,150 | $57,175 |
| 2016 | $2,911 | $62,675 | $7,150 | $55,525 |
| 2014 | $2,742 | $62,666 | $0 | $0 |
Source: Public Records
Map
Nearby Homes
- 3848 Lake Valley Dr
- 3840 Lake Valley Dr
- 3832 Lake Valley Rd
- Tbd Clearwater Dr
- 4008 Cooks Inlet Rd
- 4016 Skyland Dr
- Lot 4 Hidden Oak Cir
- 4029 Sailmakers Whip Ct
- 4292 Anchor Pointe Dr
- 3912 Inwood Dr
- 3844 Ridgeline Dr
- 1809 Topsail Ct
- 1846 Topsail Ct
- 4272 Anchor Point
- 412 Lakeside Dr
- 1684 Ridgeway Dr
- 1900 Mountain View Ave
- 1109 Cooks Terrace
- 3874 Oakley Place
- 3912 Alderwood Dr
- 000 Old Cooks Valley Rd
- 212 Dickson Place
- 216 Dickson Place
- 263 Old Cooks Valley Rd
- 220 Dickson Place
- 208 Dickson Place
- 0 Dickson Place
- LOT- Dickson Place
- 251 Old Cooks Valley Rd
- 224 Dickson Place
- 209 Dickson Place
- 205 Dickson Place
- 204 Dickson Place
- 213 Dickson Place
- 217 Dickson Place
- 271 Old Cooks Valley Rd
- 1700 Cooks Valley Rd
- 200 Dickson Place
- 330 Old Cooks Valley Rd
- 1704 Cooks Valley Rd