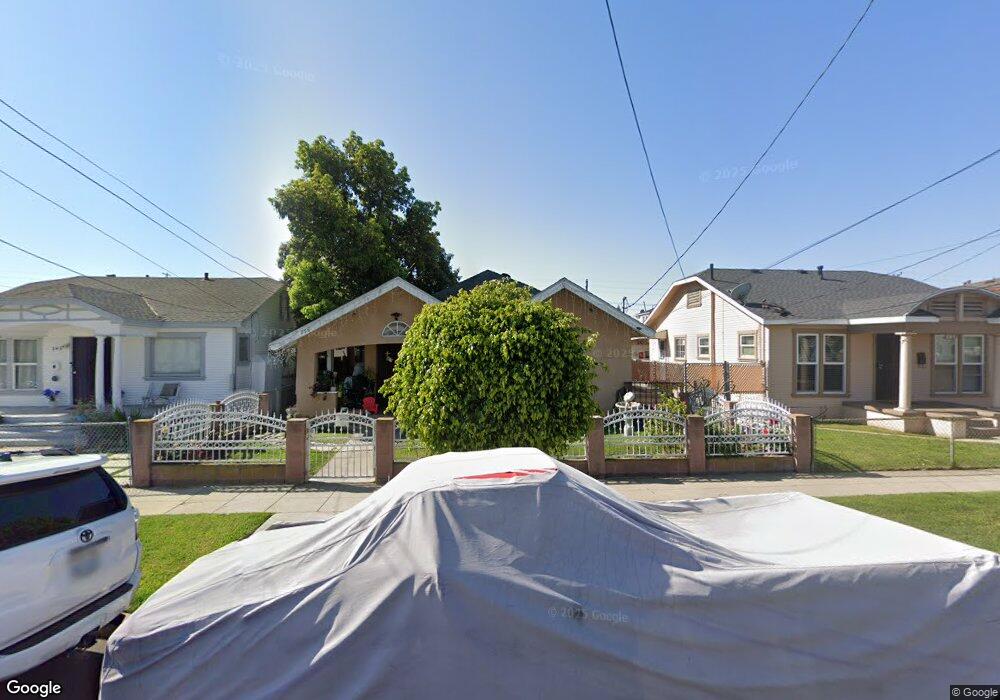
255 W Oliver St San Pedro, CA 90731
Estimated Value: $648,000 - $730,304
2
Beds
1
Bath
1,112
Sq Ft
$615/Sq Ft
Est. Value
About This Home
This home is located at 255 W Oliver St, San Pedro, CA 90731 and is currently estimated at $684,326, approximately $615 per square foot. 255 W Oliver St is a home located in Los Angeles County with nearby schools including Barton Hill Elementary School, Dana Middle School, and San Pedro Senior High School.
Ownership History
Date
Name
Owned For
Owner Type
Purchase Details
Closed on
Dec 1, 2005
Sold by
Gutierrez Antonio
Bought by
Gutierrez Antonio and Gutierrez Esmeralda
Current Estimated Value
Purchase Details
Closed on
Aug 24, 2000
Sold by
Carbajal Kathy
Bought by
Jimenez Fidel
Home Financials for this Owner
Home Financials are based on the most recent Mortgage that was taken out on this home.
Original Mortgage
$134,600
Interest Rate
7.82%
Purchase Details
Closed on
May 21, 2000
Sold by
Carbojal Rosalie A
Bought by
Carbajal Kathy
Purchase Details
Closed on
Sep 13, 1995
Sold by
Carbajal Rosalie A
Bought by
Carbajal Rosalie A
Home Financials for this Owner
Home Financials are based on the most recent Mortgage that was taken out on this home.
Original Mortgage
$30,000
Interest Rate
7.88%
Create a Home Valuation Report for This Property
The Home Valuation Report is an in-depth analysis detailing your home's value as well as a comparison with similar homes in the area
Home Values in the Area
Average Home Value in this Area
Purchase History
| Date | Buyer | Sale Price | Title Company |
|---|---|---|---|
| Gutierrez Antonio | -- | -- | |
| Jimenez Fidel | $154,000 | Landsafe Title | |
| Carbajal Kathy | -- | -- | |
| Carbajal Rosalie A | -- | Fidelity National Title Ins |
Source: Public Records
Mortgage History
| Date | Status | Borrower | Loan Amount |
|---|---|---|---|
| Previous Owner | Jimenez Fidel | $134,600 | |
| Previous Owner | Carbajal Rosalie A | $30,000 |
Source: Public Records
Tax History Compared to Growth
Tax History
| Year | Tax Paid | Tax Assessment Tax Assessment Total Assessment is a certain percentage of the fair market value that is determined by local assessors to be the total taxable value of land and additions on the property. | Land | Improvement |
|---|---|---|---|---|
| 2025 | $2,892 | $226,000 | $91,904 | $134,096 |
| 2024 | $2,892 | $221,569 | $90,102 | $131,467 |
| 2023 | $2,839 | $217,226 | $88,336 | $128,890 |
| 2022 | $2,711 | $212,967 | $86,604 | $126,363 |
| 2021 | $2,674 | $208,792 | $84,906 | $123,886 |
| 2019 | $2,596 | $202,601 | $82,389 | $120,212 |
| 2018 | $2,515 | $198,629 | $80,774 | $117,855 |
| 2016 | $2,394 | $190,919 | $77,639 | $113,280 |
| 2015 | $2,360 | $188,052 | $76,473 | $111,579 |
| 2014 | $2,359 | $184,369 | $74,975 | $109,394 |
Source: Public Records
Map
Nearby Homes
- 233 W Oliver St
- 349 W Amar St
- 335 N Palos Verdes St
- 373 W Santa Cruz St
- 302 N Pacific Ave
- 548 Bonita St
- 586 W 1st St
- 586 W Macarthur Ave
- 584 W 3rd St
- 622 W 2nd St
- 681 W Upland Ave
- 560 W 4th St
- 663 W 2nd St
- 528 530 W 19th St
- 1233 1235 W 24th St
- 745 W Oliver St
- 952 N Gaffey Place
- 285 W 6th St Unit 527
- 285 W 6th St Unit 327
- 285 W 6th St Unit 317
- 261 W Oliver St
- 249 W Oliver St
- 247 W Oliver St
- 243 W Oliver St
- 267 W Oliver St
- 237 W Oliver St
- 430 N Centre St
- 254 W Ofarrell St
- 260 W Ofarrell St
- 250 W Ofarrell St
- 268 W Ofarrell St
- 244 W Ofarrell St
- 256 W Oliver St
- 246 W Oliver St
- 238 W Ofarrell St
- 420 N Centre St
- 260 W Oliver St
- 240 W Oliver St
- 225 W Oliver St
- 266 W Oliver St