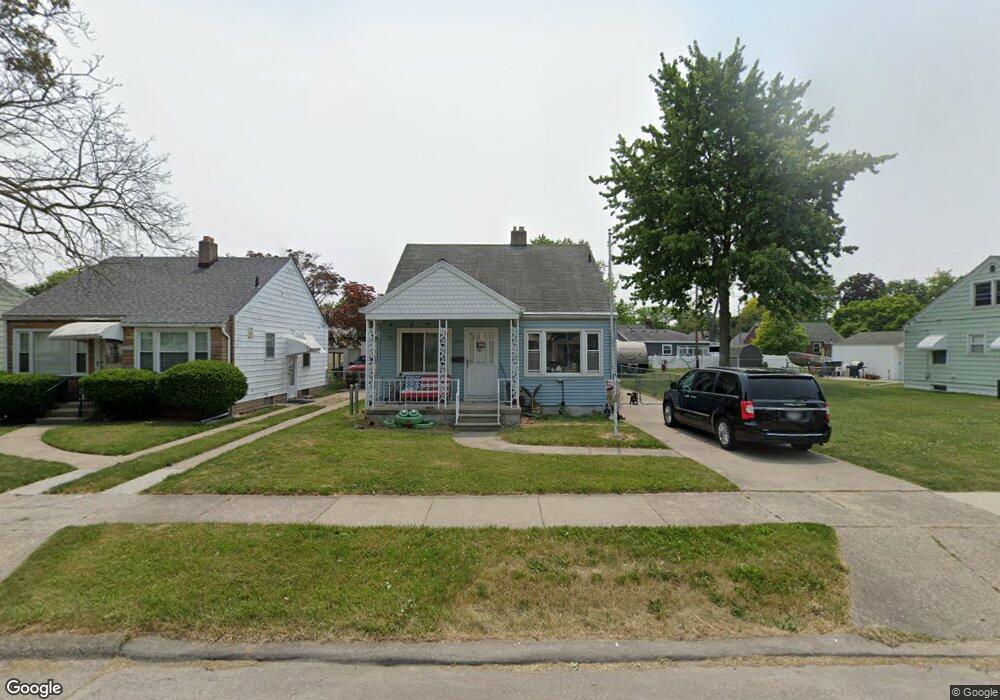
2552 106th St Toledo, OH 43611
Point Place NeighborhoodEstimated Value: $110,000 - $136,000
2
Beds
1
Bath
1,224
Sq Ft
$104/Sq Ft
Est. Value
About This Home
This home is located at 2552 106th St, Toledo, OH 43611 and is currently estimated at $127,151, approximately $103 per square foot. 2552 106th St is a home located in Lucas County with nearby schools including Ottawa River Elementary School, Woodward High School, and Imagine Environmental Science Academy.
Ownership History
Date
Name
Owned For
Owner Type
Purchase Details
Closed on
Sep 13, 2022
Sold by
Trust Of Kenneth John Rober and Rober Jacquelyn R
Bought by
Rober Jacquelyn R
Current Estimated Value
Purchase Details
Closed on
Jun 28, 2019
Sold by
Rober Kenneth John , Trustee
Bought by
Rober Jacquely R Successor Trustee
Purchase Details
Closed on
May 23, 2003
Sold by
Rober Kenneth John and Rober Kenneth J
Bought by
Rober Kenneth John and The Kenneth John Rober Trust
Purchase Details
Closed on
May 25, 1994
Sold by
Delvaux P J and M J
Create a Home Valuation Report for This Property
The Home Valuation Report is an in-depth analysis detailing your home's value as well as a comparison with similar homes in the area
Home Values in the Area
Average Home Value in this Area
Purchase History
| Date | Buyer | Sale Price | Title Company |
|---|---|---|---|
| Rober Jacquelyn R | $50,000 | None Listed On Document | |
| Rober Jacquely R Successor Trustee | -- | -- | |
| Rober Kenneth John | -- | Kaspar | |
| -- | $66,500 | -- |
Source: Public Records
Tax History Compared to Growth
Tax History
| Year | Tax Paid | Tax Assessment Tax Assessment Total Assessment is a certain percentage of the fair market value that is determined by local assessors to be the total taxable value of land and additions on the property. | Land | Improvement |
|---|---|---|---|---|
| 2024 | $929 | $30,380 | $8,295 | $22,085 |
| 2023 | $1,561 | $24,255 | $7,560 | $16,695 |
| 2022 | $1,562 | $24,255 | $7,560 | $16,695 |
| 2021 | $1,598 | $24,255 | $7,560 | $16,695 |
| 2020 | $1,708 | $22,995 | $5,565 | $17,430 |
| 2019 | $1,661 | $22,995 | $5,565 | $17,430 |
| 2018 | $1,680 | $22,995 | $5,565 | $17,430 |
| 2017 | $2,736 | $22,470 | $5,425 | $17,045 |
| 2016 | $1,707 | $64,200 | $15,500 | $48,700 |
| 2015 | $1,691 | $64,200 | $15,500 | $48,700 |
| 2014 | $1,414 | $22,480 | $5,430 | $17,050 |
| 2013 | $1,414 | $22,480 | $5,430 | $17,050 |
Source: Public Records
Map
Nearby Homes