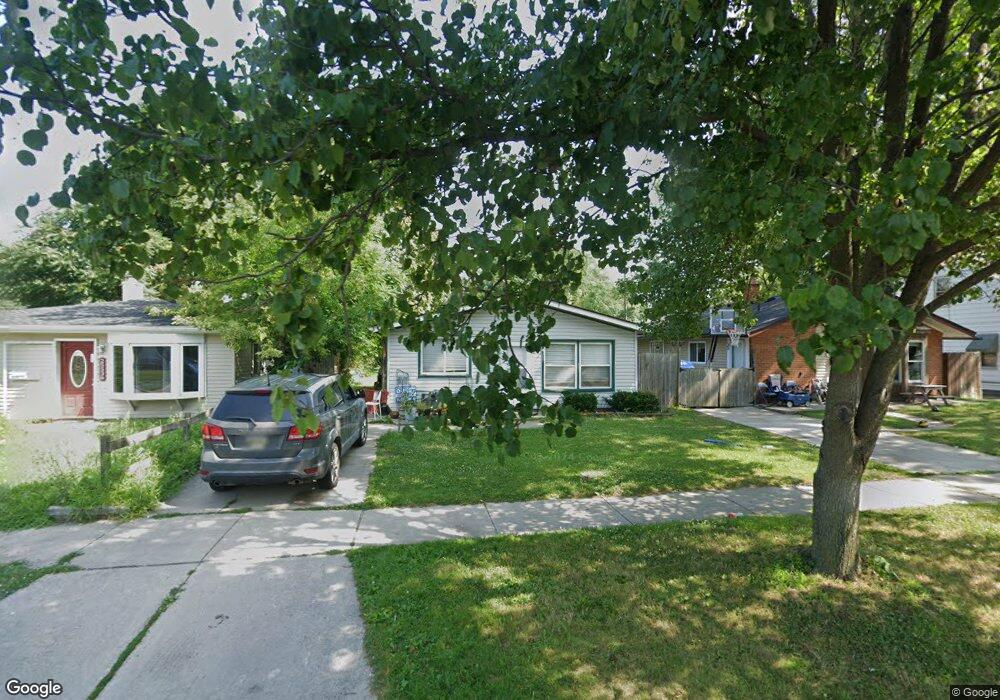
25526 Powers Ave Dearborn Heights, MI 48125
Estimated Value: $123,000 - $165,547
3
Beds
1
Bath
936
Sq Ft
$155/Sq Ft
Est. Value
About This Home
This home is located at 25526 Powers Ave, Dearborn Heights, MI 48125 and is currently estimated at $144,637, approximately $154 per square foot. 25526 Powers Ave is a home located in Wayne County with nearby schools including Quest Charter Academy, West Village Academy, and Peterson-Warren Academy.
Ownership History
Date
Name
Owned For
Owner Type
Purchase Details
Closed on
Mar 13, 2024
Sold by
Declaration Of Trust For Laurel A Steven and Stevens Laurel A
Bought by
Ksj-Llc
Current Estimated Value
Purchase Details
Closed on
Jul 18, 2018
Sold by
Hussein Samart G
Bought by
Trust For Laurel A Stevens
Purchase Details
Closed on
Aug 16, 2012
Sold by
Hussein Bilal G
Bought by
Hussein Samar G
Purchase Details
Closed on
Nov 12, 2008
Sold by
The Bank Of New York Mellon Trust Compan
Bought by
Hussein Bilal G
Purchase Details
Closed on
Feb 7, 2008
Sold by
Shippey Tiffany N
Bought by
The Bank Of New York Trust Co Na and Jp Morgan Chase Bank Na
Purchase Details
Closed on
May 13, 2003
Sold by
Patterson Ronald W and Patterson Betty
Bought by
Shippey Tiffany N
Purchase Details
Closed on
May 2, 2003
Sold by
Moss David L and Moss Debbie A
Bought by
Patterson Ronald W
Create a Home Valuation Report for This Property
The Home Valuation Report is an in-depth analysis detailing your home's value as well as a comparison with similar homes in the area
Home Values in the Area
Average Home Value in this Area
Purchase History
| Date | Buyer | Sale Price | Title Company |
|---|---|---|---|
| Ksj-Llc | $675,000 | Title One | |
| Ksj-Llc | $675,000 | Title One | |
| Trust For Laurel A Stevens | $60,000 | None Available | |
| Hussein Samar G | $200 | None Available | |
| Hussein Bilal G | $20,000 | Attorneys Title Agency Llc | |
| The Bank Of New York Trust Co Na | $39,600 | None Available | |
| Shippey Tiffany N | $83,000 | Great Lakes Title Of Michiga | |
| Patterson Ronald W | $32,000 | Great Lakes Title Of Michiga |
Source: Public Records
Tax History Compared to Growth
Tax History
| Year | Tax Paid | Tax Assessment Tax Assessment Total Assessment is a certain percentage of the fair market value that is determined by local assessors to be the total taxable value of land and additions on the property. | Land | Improvement |
|---|---|---|---|---|
| 2025 | $1,318 | $58,300 | $0 | $0 |
| 2024 | $1,318 | $48,200 | $0 | $0 |
| 2023 | $1,198 | $41,500 | $0 | $0 |
| 2022 | $1,761 | $35,100 | $0 | $0 |
| 2021 | $1,748 | $31,000 | $0 | $0 |
| 2019 | $1,619 | $24,400 | $0 | $0 |
| 2018 | $914 | $22,400 | $0 | $0 |
| 2017 | $944 | $21,500 | $0 | $0 |
| 2016 | $1,355 | $21,800 | $0 | $0 |
| 2015 | $2,030 | $20,300 | $0 | $0 |
| 2013 | $2,190 | $23,100 | $0 | $0 |
| 2010 | -- | $27,400 | $0 | $0 |
Source: Public Records
Map
Nearby Homes
- 25628 Powers Ave
- 5118 Michael St
- 25474 McDonald St
- 25926 Powers Ave
- 25965 Currier St
- 25895 Annapolis St
- 5842 Janet St
- 26106 Powers Ave
- 5845 Beech Daly Rd
- 4856 Carolee Ln
- 5904 Janet St
- 25243 Lehigh St
- 5961 Beech Daly Rd
- 25212 Lehigh St
- 25118 Lehigh St
- 26225 McDonald St
- 5963 Vivian St
- 24754 Annapolis St
- 5961 Marvin St
- 6020 Vivian St
- 25536 Powers Ave
- 25518 Powers Ave
- 25510 Powers Ave
- 25548 Powers Ave
- 25543 Pennie St
- 25527 Pennie St
- 25519 Pennie St
- 25549 Pennie St
- 25525 Powers Ave
- 25515 Powers Ave
- 25535 Powers Ave
- 25468 Powers Ave
- 25469 Pennie St
- 25547 Powers Ave
- 25493 Powers Ave
- 25458 Powers Ave
- 25459 Pennie St
- 25481 Powers Ave
- 25612 Powers Ave
- 25605 Powers Ave