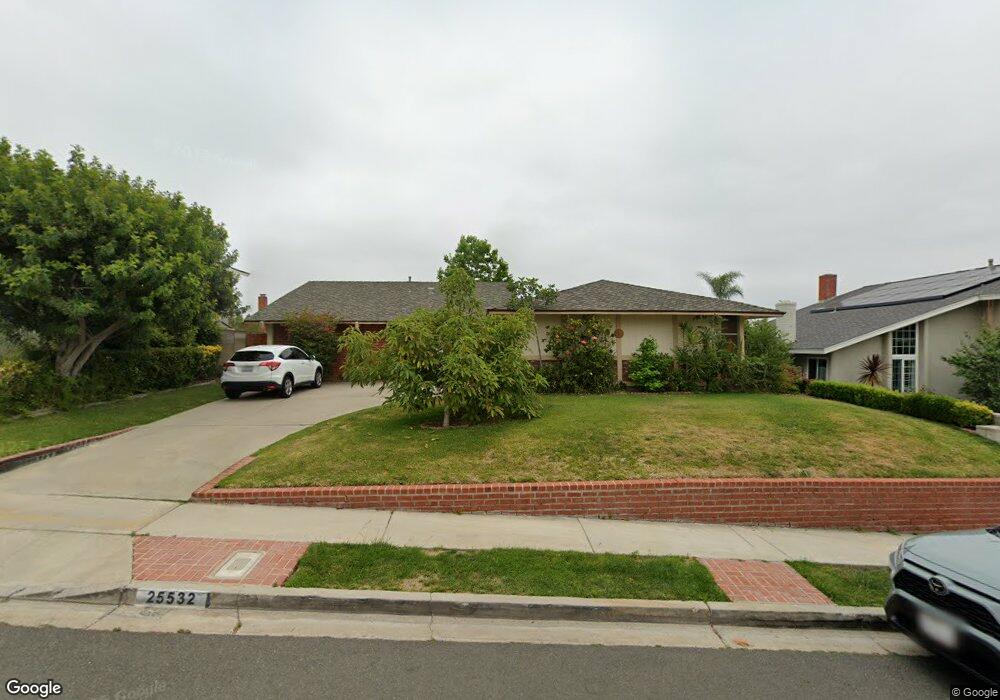
25532 Althea Ave Mission Viejo, CA 92691
Estimated Value: $1,241,611 - $1,367,000
4
Beds
2
Baths
2,064
Sq Ft
$629/Sq Ft
Est. Value
About This Home
This home is located at 25532 Althea Ave, Mission Viejo, CA 92691 and is currently estimated at $1,298,903, approximately $629 per square foot. 25532 Althea Ave is a home located in Orange County with nearby schools including Del Cerro Elementary School, Los Alisos Intermediate School, and Mission Viejo High School.
Ownership History
Date
Name
Owned For
Owner Type
Purchase Details
Closed on
Dec 28, 2020
Sold by
Venanzi Lois C and Venanzi Stephen G
Bought by
Venanzi Stephen and Venanzi Lois
Current Estimated Value
Purchase Details
Closed on
Oct 14, 1998
Sold by
Ananian Fred A and Ananian Kim A
Bought by
Venanzi Stephen G and Venanzi Lois C
Purchase Details
Closed on
Mar 16, 1996
Sold by
Ananian Kim
Bought by
Ananian Fred
Home Financials for this Owner
Home Financials are based on the most recent Mortgage that was taken out on this home.
Original Mortgage
$196,200
Interest Rate
7.34%
Purchase Details
Closed on
Mar 3, 1996
Sold by
Amico Charles and Amico Guiseppa
Bought by
Ananian Fred
Home Financials for this Owner
Home Financials are based on the most recent Mortgage that was taken out on this home.
Original Mortgage
$196,200
Interest Rate
7.34%
Create a Home Valuation Report for This Property
The Home Valuation Report is an in-depth analysis detailing your home's value as well as a comparison with similar homes in the area
Home Values in the Area
Average Home Value in this Area
Purchase History
| Date | Buyer | Sale Price | Title Company |
|---|---|---|---|
| Venanzi Stephen | -- | None Available | |
| Venanzi Stephen G | -- | -- | |
| Ananian Fred | -- | Fidelity National Title Ins | |
| Ananian Fred | $218,000 | Fidelity National Title Ins |
Source: Public Records
Mortgage History
| Date | Status | Borrower | Loan Amount |
|---|---|---|---|
| Previous Owner | Ananian Fred | $196,200 |
Source: Public Records
Tax History Compared to Growth
Tax History
| Year | Tax Paid | Tax Assessment Tax Assessment Total Assessment is a certain percentage of the fair market value that is determined by local assessors to be the total taxable value of land and additions on the property. | Land | Improvement |
|---|---|---|---|---|
| 2025 | $4,366 | $431,111 | $292,120 | $138,991 |
| 2024 | $4,366 | $422,658 | $286,392 | $136,266 |
| 2023 | $4,263 | $414,371 | $280,776 | $133,595 |
| 2022 | $4,187 | $406,247 | $275,271 | $130,976 |
| 2021 | $4,104 | $398,282 | $269,874 | $128,408 |
| 2020 | $4,068 | $394,199 | $267,107 | $127,092 |
| 2019 | $3,987 | $386,470 | $261,870 | $124,600 |
| 2018 | $3,912 | $378,893 | $256,736 | $122,157 |
| 2017 | $3,834 | $371,464 | $251,702 | $119,762 |
| 2016 | $3,771 | $364,181 | $246,767 | $117,414 |
| 2015 | $3,726 | $358,711 | $243,060 | $115,651 |
| 2014 | $3,645 | $351,685 | $238,299 | $113,386 |
Source: Public Records
Map
Nearby Homes
- 25481 Classic Dr
- 25412 Pacifica Ave
- 25391 Classic Dr
- 23962 Warsaw St
- 25362 Felicia Ct
- 25312 Cassandra Ct
- 23801 Birch Ln
- 25742 Appian Way
- 24412 Verena Ct
- 24591 Spartan St
- 24282 Twig St
- 23652 Algiers St
- 25981 Cordillera Dr
- 24612 Artemia Ave
- 25835 Appian Way
- 23576 Rangoon St
- 24711 Acropolis Dr
- 25631 Minos St
- 24755 Acropolis Dr
- 24762 Acropolis Dr
- 25542 Althea Ave
- 25522 Althea Ave
- 25511 Classic Dr
- 25501 Classic Dr
- 25521 Classic Dr
- 25552 Althea Ave
- 25516 Althea Ave
- 25541 Althea Ave
- 25531 Althea Ave
- 25491 Classic Dr
- 25551 Althea Ave
- 25521 Althea Ave
- 25512 Althea Ave
- 25561 Althea Ave
- 25592 Adriana St
- 24102 Adonis St
- 24141 Adonis St
- 25582 Adriana St
- 25501 Althea Ave
- 25571 Althea Ave