2556 21st St Sacramento, CA 95818
Curtis Park NeighborhoodEstimated Value: $454,673 - $721,000
4
Beds
1
Bath
1,764
Sq Ft
$309/Sq Ft
Est. Value
About This Home
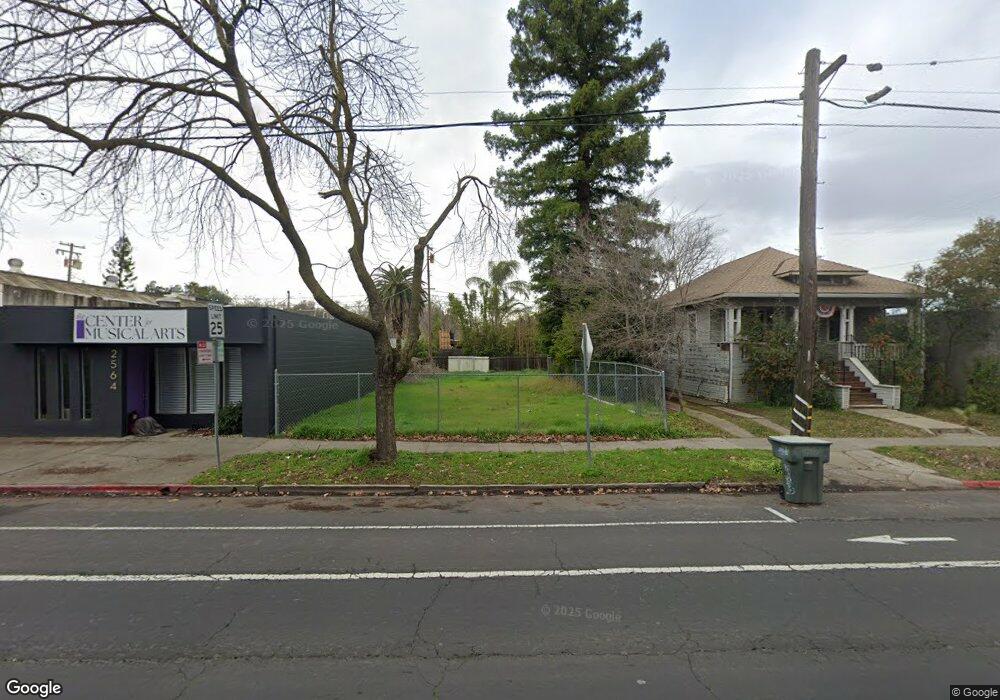
This home is located at 2556 21st St, Sacramento, CA 95818 and is currently estimated at $544,891, approximately $308 per square foot. 2556 21st St is a home located in Sacramento County with nearby schools including Crocker/Riverside Elementary School, California Middle, and C. K. McClatchy High.
Ownership History
Date
Name
Owned For
Owner Type
Purchase Details
Closed on
Oct 8, 2024
Sold by
Jones Charles E and Jones-Flaum Sharla J
Bought by
Owens Family Trust and Owens
Current Estimated Value
Purchase Details
Closed on
Dec 22, 2021
Sold by
Jones Sr Charles E
Bought by
Jones Revocable Trust
Purchase Details
Closed on
Oct 19, 2021
Sold by
Jones Reyes Sharon L and The Jones Revocable Trust
Bought by
Jones Charles E and Jones Flaum Sharla
Purchase Details
Closed on
Jun 20, 1996
Sold by
Jones Charles E and Jones Marguerite J
Bought by
Jones Marguerite J and Jones Charles E
Create a Home Valuation Report for This Property
The Home Valuation Report is an in-depth analysis detailing your home's value as well as a comparison with similar homes in the area
Home Values in the Area
Average Home Value in this Area
Purchase History
| Date | Buyer | Sale Price | Title Company |
|---|---|---|---|
| Owens Family Trust | $450,000 | Placer Title | |
| Jones Revocable Trust | -- | -- | |
| Jones Charles E | -- | None Available | |
| Jones Marguerite J | -- | -- |
Source: Public Records
Tax History Compared to Growth
Tax History
| Year | Tax Paid | Tax Assessment Tax Assessment Total Assessment is a certain percentage of the fair market value that is determined by local assessors to be the total taxable value of land and additions on the property. | Land | Improvement |
|---|---|---|---|---|
| 2025 | $884 | $450,000 | $450,000 | -- |
| 2024 | $884 | $43,519 | $43,519 | -- |
| 2023 | $872 | $42,666 | $42,666 | $0 |
| 2022 | $1,009 | $41,830 | $41,830 | $0 |
| 2021 | $637 | $41,010 | $41,010 | $0 |
| 2020 | $639 | $40,590 | $40,590 | $0 |
| 2019 | $627 | $39,795 | $39,795 | $0 |
| 2018 | $613 | $39,015 | $39,015 | $0 |
| 2017 | $608 | $38,250 | $38,250 | $0 |
| 2016 | $551 | $37,500 | $37,500 | $0 |
| 2015 | $545 | $36,937 | $36,937 | $0 |
| 2014 | $532 | $36,214 | $36,214 | $0 |
Source: Public Records
Map
Nearby Homes