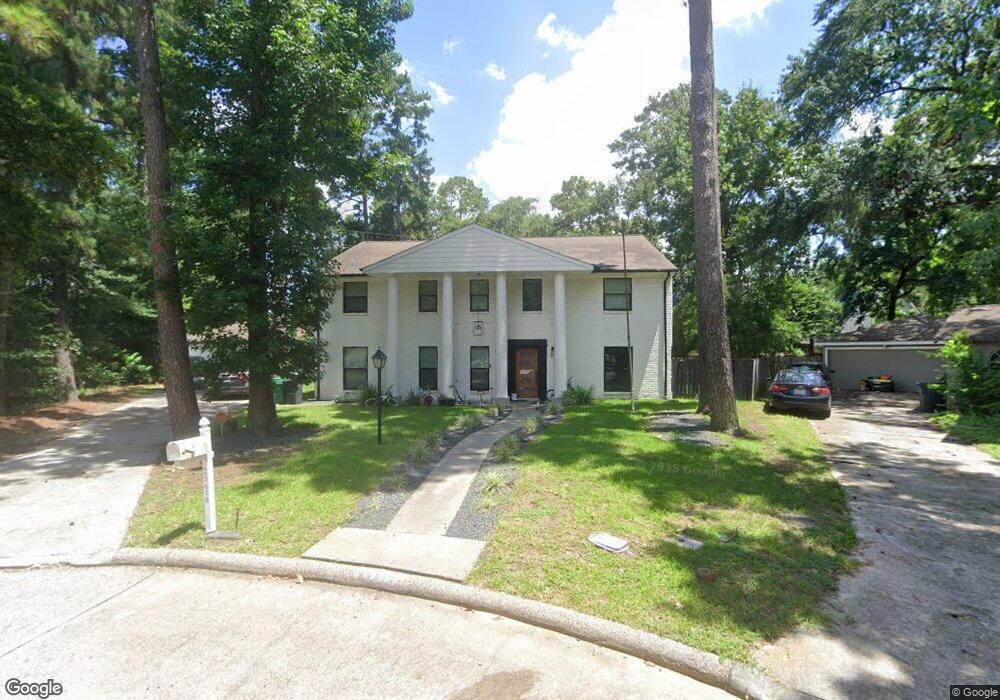
25618 Walnut Grove Cr Cir Spring, TX 77380
Grogan's Mill NeighborhoodEstimated Value: $498,000 - $657,016
5
Beds
4
Baths
3,672
Sq Ft
$161/Sq Ft
Est. Value
About This Home
This home is located at 25618 Walnut Grove Cr Cir, Spring, TX 77380 and is currently estimated at $589,754, approximately $160 per square foot. 25618 Walnut Grove Cr Cir is a home located in Montgomery County with nearby schools including Lamar Elementary School, W.D Wilkerson Intermediate School, and Knox J High School.
Ownership History
Date
Name
Owned For
Owner Type
Purchase Details
Closed on
Jul 21, 2023
Sold by
Arroyo Glorivel
Bought by
Nguyen Daniel and Vo Christina
Current Estimated Value
Home Financials for this Owner
Home Financials are based on the most recent Mortgage that was taken out on this home.
Original Mortgage
$500,000
Outstanding Balance
$486,888
Interest Rate
6.71%
Mortgage Type
Construction
Estimated Equity
$102,866
Purchase Details
Closed on
Mar 7, 2022
Sold by
Crainiciuc and Salman
Bought by
Arroyo Glorivel
Purchase Details
Closed on
Jun 15, 2021
Sold by
Telotte Mary Louise Donnelly and Telotte Mary Louise
Bought by
Crainiciuc Sabina
Purchase Details
Closed on
May 1, 1987
Bought by
Telotte Mary D
Create a Home Valuation Report for This Property
The Home Valuation Report is an in-depth analysis detailing your home's value as well as a comparison with similar homes in the area
Home Values in the Area
Average Home Value in this Area
Purchase History
| Date | Buyer | Sale Price | Title Company |
|---|---|---|---|
| Nguyen Daniel | $500,000 | Magnolia Title Agency | |
| Arroyo Glorivel | -- | Capital Title | |
| Crainiciuc Sabina | -- | First American Title | |
| Telotte Mary D | -- | -- |
Source: Public Records
Mortgage History
| Date | Status | Borrower | Loan Amount |
|---|---|---|---|
| Open | Nguyen Daniel | $500,000 |
Source: Public Records
Tax History Compared to Growth
Tax History
| Year | Tax Paid | Tax Assessment Tax Assessment Total Assessment is a certain percentage of the fair market value that is determined by local assessors to be the total taxable value of land and additions on the property. | Land | Improvement |
|---|---|---|---|---|
| 2025 | $7,044 | $500,000 | $17,726 | $482,274 |
| 2024 | $8,785 | $553,587 | $17,726 | $535,861 |
| 2023 | $8,785 | $506,130 | $17,710 | $488,420 |
| 2022 | $7,697 | $406,140 | $17,710 | $388,430 |
| 2021 | $5,078 | $252,790 | $17,710 | $235,080 |
| 2020 | $5,213 | $247,720 | $17,710 | $230,010 |
| 2019 | $5,204 | $239,330 | $17,710 | $221,620 |
| 2018 | $3,865 | $234,170 | $17,710 | $216,460 |
| 2017 | $5,099 | $234,170 | $17,710 | $216,460 |
| 2016 | $5,099 | $234,170 | $17,710 | $216,460 |
| 2015 | $3,537 | $218,330 | $17,710 | $222,010 |
| 2014 | $3,537 | $198,480 | $17,710 | $203,730 |
Source: Public Records
Map
Nearby Homes
- 25706 Overlake Dr
- 402 Pine Edge Dr
- 25606 Pecan Valley Cir
- 25607 Pecan Valley Cir
- 25427 Elm Creek Dr
- 25419 Elm Creek Dr
- 34 Lyrebird Dr
- 17 Night Hawk Place
- 722 Shadowbrook Dr
- 723 Shadowbrook Dr
- 90 Crystal Lake Ln
- 424 Nursery Rd
- 13 Honey Daffodil Place
- 119 Heatherwood Dr
- 426 Nursery Rd
- 67 Marabou Place
- 33 Crystal Lake Ln
- 51 Marabou Place
- 713 Sawdust Rd
- 0 Sagewood
- 25618 Walnut Grove Cir
- 25615 Walnut Grove Cir
- 25614 Walnut Grove Cir
- 423 Champion Lake Dr
- 427 Champion Lake Dr
- 419 Champion Lake Dr
- 25611 Walnut Grove Cir
- 431 Champion Lake Dr
- 25614 Pine Acres Cir
- 25615 Ridgebrook Cir
- 25606 Walnut Grove Cir
- 25607 Walnut Grove Cir
- 25611 Ridgebrook Cir
- 25611 Ridgebrook CI
- 25610 Pine Acres Cir
- 435 Champion Lake Dr
- 411 Champion Lake Dr
- 25607 Ridgebrook Cir
- 422 Champion Lake Dr
- 426 Champion Lake Dr