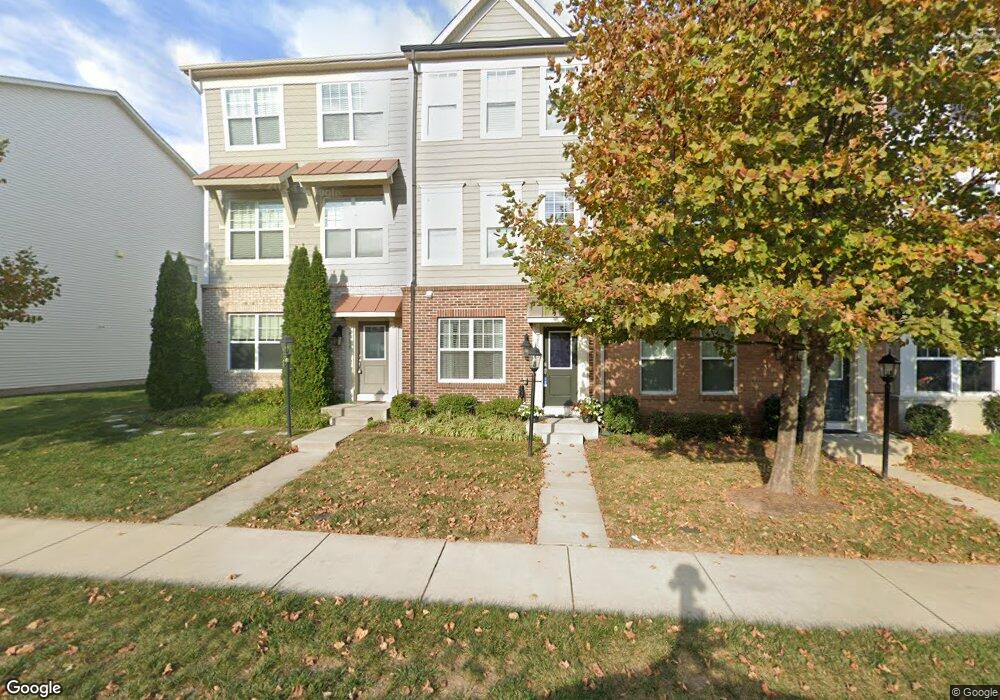
25633 Pleasant Valley Rd Chantilly, VA 20152
Estimated Value: $231,551 - $344,000
3
Beds
2
Baths
1,686
Sq Ft
$163/Sq Ft
Est. Value
About This Home
This home is located at 25633 Pleasant Valley Rd, Chantilly, VA 20152 and is currently estimated at $274,184, approximately $162 per square foot. 25633 Pleasant Valley Rd is a home located in Loudoun County with nearby schools including Cardinal Ridge Elementary School, Mercer Middle School, and John Champe High School.
Ownership History
Date
Name
Owned For
Owner Type
Purchase Details
Closed on
Sep 30, 2021
Sold by
Board Of Supervisors Of Loudoun County V
Bought by
Tanushi Julian and Zogolli Modela
Current Estimated Value
Home Financials for this Owner
Home Financials are based on the most recent Mortgage that was taken out on this home.
Original Mortgage
$140,114
Outstanding Balance
$127,771
Interest Rate
2.8%
Mortgage Type
New Conventional
Estimated Equity
$146,413
Purchase Details
Closed on
Jul 26, 2021
Sold by
Aguilera Fiestas Ricardo Steve and Aguilera Jamie Rhea-Lynn
Bought by
Board Of Supervisors Of Loudoun County V
Purchase Details
Closed on
Jan 29, 2015
Sold by
M I Homes Of Dc Llc
Bought by
Aguilera Ricardo
Home Financials for this Owner
Home Financials are based on the most recent Mortgage that was taken out on this home.
Original Mortgage
$131,127
Interest Rate
3.81%
Mortgage Type
New Conventional
Create a Home Valuation Report for This Property
The Home Valuation Report is an in-depth analysis detailing your home's value as well as a comparison with similar homes in the area
Home Values in the Area
Average Home Value in this Area
Purchase History
| Date | Buyer | Sale Price | Title Company |
|---|---|---|---|
| Tanushi Julian | $147,488 | Loudoun Commercial Title Llc | |
| Board Of Supervisors Of Loudoun County V | $145,308 | Loudoun Commercial Title Llc | |
| Aguilera Ricardo | $128,557 | -- |
Source: Public Records
Mortgage History
| Date | Status | Borrower | Loan Amount |
|---|---|---|---|
| Open | Tanushi Julian | $140,114 | |
| Previous Owner | Aguilera Ricardo | $131,127 |
Source: Public Records
Tax History Compared to Growth
Tax History
| Year | Tax Paid | Tax Assessment Tax Assessment Total Assessment is a certain percentage of the fair market value that is determined by local assessors to be the total taxable value of land and additions on the property. | Land | Improvement |
|---|---|---|---|---|
| 2025 | $1,378 | $171,200 | $17,120 | $154,080 |
| 2024 | $1,444 | $166,920 | $16,690 | $150,230 |
| 2023 | $1,401 | $160,090 | $16,010 | $144,080 |
| 2022 | $1,328 | $149,180 | $14,920 | $134,260 |
| 2021 | $1,389 | $250,820 | $14,000 | $236,820 |
| 2020 | $1,451 | $230,140 | $14,000 | $216,140 |
| 2019 | $1,441 | $224,020 | $14,000 | $210,020 |
| 2018 | $1,462 | $134,790 | $13,480 | $121,310 |
| 2017 | $1,486 | $214,610 | $14,000 | $200,610 |
| 2016 | $1,482 | $129,390 | $0 | $0 |
| 2015 | $1,458 | $114,500 | $0 | $114,500 |
| 2014 | $162 | $0 | $0 | $0 |
Source: Public Records
Map
Nearby Homes
- 44075 Peirosa Terrace
- 44033 Etna Terrace Unit .
- 44132 Puma Square
- 4480 Pleasant Valley Rd
- 15205 Bannon Hill Ct
- 25817 Spring Farm Cir
- 4610 Fairfax Manor Ct
- 43610 Mckay Terrace
- 4627 Fairfax Manor Ct
- 4615 Fairfax Manor Ct
- 4616 Fairfax Manor Ct
- 4622 Fairfax Manor Ct
- 25480 Schooley Mill Terrace
- 0 Fairfax Manor Ct Unit VAFX2160912
- 0 Pleasant Valley Rd Unit VAFX2264084
- 0 Pleasant Valley Rd Unit VAFX2264140
- 4621 Fairfax Manor Ct
- 25897 Flintonbridge Dr
- 4620 Pleasant Valley Rd
- 4628 Fairfax Manor Ct
- 25631 Pleasant Valley Rd
- 25635 Pleasant Valley Rd
- 25629 Pleasant Valley Rd
- 25641 Pleasant Valley Rd
- 25627 Pleasant Valley Rd
- 25643 Pleasant Valley Rd
- 25558 Palenza Terrace
- 25560 Palenza Terrace
- 25562 Palenza Terrace
- 25566 Palenza Terrace
- 25556 Palenza Terrace
- 25623 Pleasant Valley Rd
- 25645 Pleasant Valley Rd
- 25647 Pleasant Valley Rd
- 25621 Pleasant Valley Rd
- 25568 Palenza Terrace
- 25619 Pleasant Valley Rd
- 25570 Palenza Terrace
- 44082 Etna Terrace
- 44080 Etna Terrace