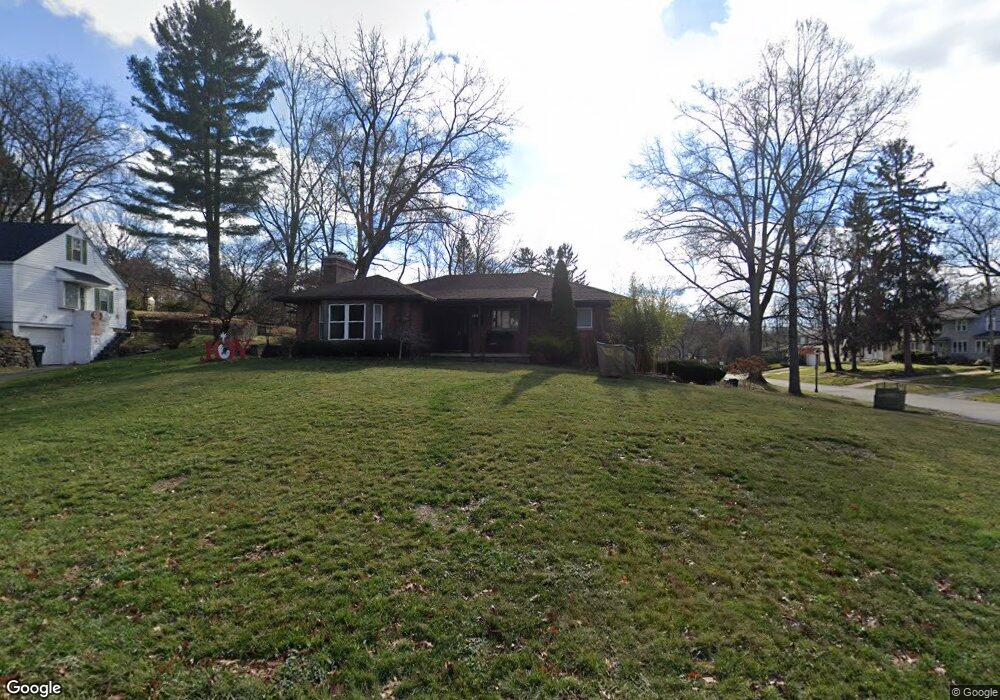
2570 Falls Ave Cuyahoga Falls, OH 44223
Cuyahoga View NeighborhoodEstimated Value: $253,657 - $312,000
3
Beds
2
Baths
1,684
Sq Ft
$161/Sq Ft
Est. Value
About This Home
This home is located at 2570 Falls Ave, Cuyahoga Falls, OH 44223 and is currently estimated at $271,164, approximately $161 per square foot. 2570 Falls Ave is a home located in Summit County with nearby schools including Richardson Elementary School, Bolich Middle School, and Cuyahoga Falls High School.
Ownership History
Date
Name
Owned For
Owner Type
Purchase Details
Closed on
Oct 8, 2003
Sold by
Evans Dustin T and Evans Kris
Bought by
Coffman Matthew D and Coffman Linda M
Current Estimated Value
Home Financials for this Owner
Home Financials are based on the most recent Mortgage that was taken out on this home.
Original Mortgage
$132,800
Outstanding Balance
$63,160
Interest Rate
6.49%
Mortgage Type
Purchase Money Mortgage
Estimated Equity
$208,004
Purchase Details
Closed on
Mar 12, 2003
Sold by
Sheppard Lynette S and Evans Jorja A
Bought by
Evans Dustin T
Create a Home Valuation Report for This Property
The Home Valuation Report is an in-depth analysis detailing your home's value as well as a comparison with similar homes in the area
Home Values in the Area
Average Home Value in this Area
Purchase History
| Date | Buyer | Sale Price | Title Company |
|---|---|---|---|
| Coffman Matthew D | $166,000 | Real Living Title Agency Ltd | |
| Evans Dustin T | $100,000 | -- |
Source: Public Records
Mortgage History
| Date | Status | Borrower | Loan Amount |
|---|---|---|---|
| Open | Coffman Matthew D | $132,800 |
Source: Public Records
Tax History Compared to Growth
Tax History
| Year | Tax Paid | Tax Assessment Tax Assessment Total Assessment is a certain percentage of the fair market value that is determined by local assessors to be the total taxable value of land and additions on the property. | Land | Improvement |
|---|---|---|---|---|
| 2025 | $3,773 | $69,892 | $10,899 | $58,993 |
| 2024 | $3,773 | $69,892 | $10,899 | $58,993 |
| 2023 | $3,773 | $69,892 | $10,899 | $58,993 |
| 2022 | $3,937 | $59,231 | $9,237 | $49,994 |
| 2021 | $3,936 | $59,231 | $9,237 | $49,994 |
| 2020 | $3,872 | $59,230 | $9,240 | $49,990 |
| 2019 | $3,710 | $51,700 | $8,780 | $42,920 |
| 2018 | $3,151 | $51,700 | $8,780 | $42,920 |
| 2017 | $2,565 | $51,700 | $8,780 | $42,920 |
| 2016 | $2,567 | $42,670 | $8,780 | $33,890 |
| 2015 | $2,565 | $42,670 | $8,780 | $33,890 |
| 2014 | $2,567 | $42,670 | $8,780 | $33,890 |
| 2013 | $2,719 | $45,590 | $8,780 | $36,810 |
Source: Public Records
Map
Nearby Homes