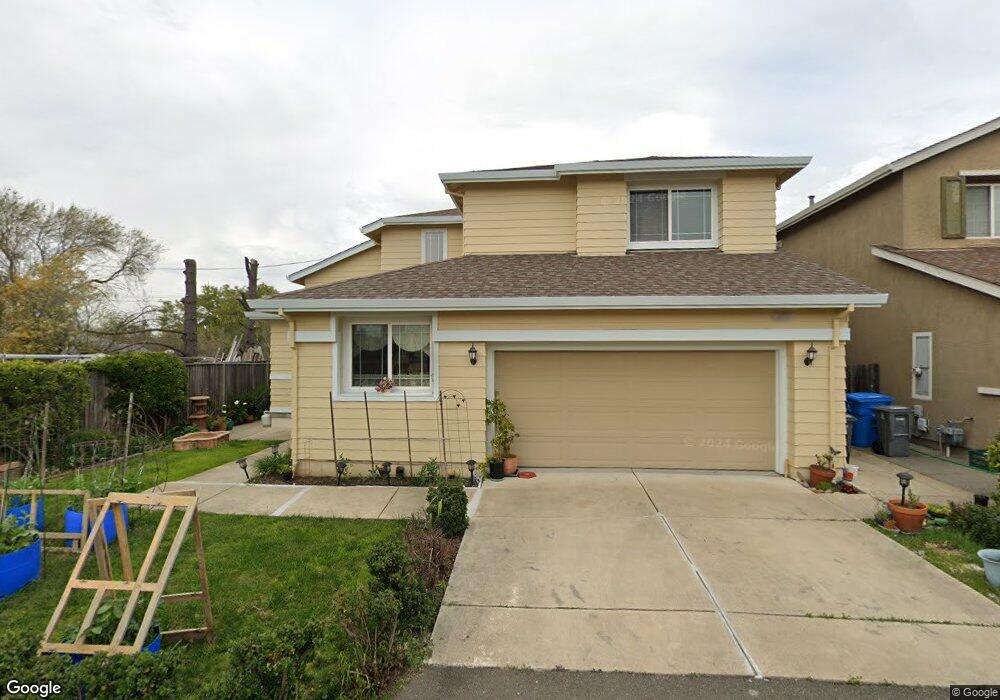
2577 Bellevue Ranch Santa Rosa, CA 95407
Estimated Value: $625,000 - $819,000
4
Beds
3
Baths
2,206
Sq Ft
$339/Sq Ft
Est. Value
About This Home
This home is located at 2577 Bellevue Ranch, Santa Rosa, CA 95407 and is currently estimated at $748,119, approximately $339 per square foot. 2577 Bellevue Ranch is a home located in Sonoma County with nearby schools including Elsie Allen High School and St. Michael's Orthodox School.
Ownership History
Date
Name
Owned For
Owner Type
Purchase Details
Closed on
Dec 20, 2007
Sold by
Li Li and Chan Joe Cho Kin
Bought by
Chan Joe Cho Kin and Li Li
Current Estimated Value
Home Financials for this Owner
Home Financials are based on the most recent Mortgage that was taken out on this home.
Original Mortgage
$190,000
Outstanding Balance
$117,562
Interest Rate
5.87%
Mortgage Type
New Conventional
Estimated Equity
$630,557
Purchase Details
Closed on
Dec 12, 2003
Sold by
Chan Joe Cho Kin and Li Li
Bought by
Chan Joe Cho Kin and Li Li
Home Financials for this Owner
Home Financials are based on the most recent Mortgage that was taken out on this home.
Original Mortgage
$210,000
Interest Rate
3.87%
Mortgage Type
Purchase Money Mortgage
Purchase Details
Closed on
Mar 11, 2003
Bought by
Chan Joe Cho-Kin and Li Li
Create a Home Valuation Report for This Property
The Home Valuation Report is an in-depth analysis detailing your home's value as well as a comparison with similar homes in the area
Home Values in the Area
Average Home Value in this Area
Purchase History
| Date | Buyer | Sale Price | Title Company |
|---|---|---|---|
| Chan Joe Cho Kin | -- | First American Title Co | |
| Chan Joe Cho Kin | -- | Chicago Title Co | |
| Chan Joe Cho-Kin | $409,000 | -- |
Source: Public Records
Mortgage History
| Date | Status | Borrower | Loan Amount |
|---|---|---|---|
| Open | Chan Joe Cho Kin | $190,000 | |
| Closed | Chan Joe Cho Kin | $210,000 |
Source: Public Records
Tax History Compared to Growth
Tax History
| Year | Tax Paid | Tax Assessment Tax Assessment Total Assessment is a certain percentage of the fair market value that is determined by local assessors to be the total taxable value of land and additions on the property. | Land | Improvement |
|---|---|---|---|---|
| 2025 | $6,820 | $591,932 | $217,247 | $374,685 |
| 2024 | $6,820 | $580,327 | $212,988 | $367,339 |
| 2023 | $6,820 | $568,949 | $208,812 | $360,137 |
| 2022 | $6,658 | $557,794 | $204,718 | $353,076 |
| 2021 | $6,504 | $546,857 | $200,704 | $346,153 |
| 2020 | $6,317 | $541,251 | $198,647 | $342,604 |
| 2019 | $6,322 | $530,639 | $194,752 | $335,887 |
| 2018 | $6,271 | $520,235 | $190,934 | $329,301 |
| 2017 | $6,120 | $510,036 | $187,191 | $322,845 |
| 2016 | $6,047 | $500,036 | $183,521 | $316,515 |
| 2015 | -- | $472,000 | $173,000 | $299,000 |
| 2014 | -- | $415,000 | $152,000 | $263,000 |
Source: Public Records
Map
Nearby Homes
- 2630 Arrowhead Dr
- 2863 Liscum St
- 2622 Arrowhead Dr
- 2632 Wild Bill Way
- 2912 Liscum St
- 2599 Silver Spur Dr
- 2931 Liscum St
- 2766 Sassy St
- 2778 Sassy St
- Plan 2 at Grove Village
- Plan 4 at Grove Village
- Plan 5 at Grove Village
- Plan 1 at Grove Village
- Plan 6 at Grove Village
- 2928 Liscum St
- 2786 Sassy St
- 2790 Sassy St
- 2794 Sassy St
- 2716 Amora Cir
- 2779 Sassy St
- 2571 Bellevue Ranch
- 2563 Bellevue Ranch
- 2567 Bellevue Ranch
- 2555 Bellevue Ranch
- 2736 Stony Point Rd
- 2607 Bellevue Ranch
- 2601 Bellevue Ranch
- 2615 Bellevue Ranch
- 2732 Stony Point Rd
- 2724 Stony Point Rd
- 2787 Liscum St
- 2621 Bellevue Ranch
- 2551 Bellevue Ranch
- 2722 Stony Point Rd
- 2740 Stony Point Rd
- 2781 Liscum St
- 2545 Bellevue Ranch
- 2710 Stony Point Rd
- 2803 Bighorn Sheep St
- 2600 Bellevue Ranch