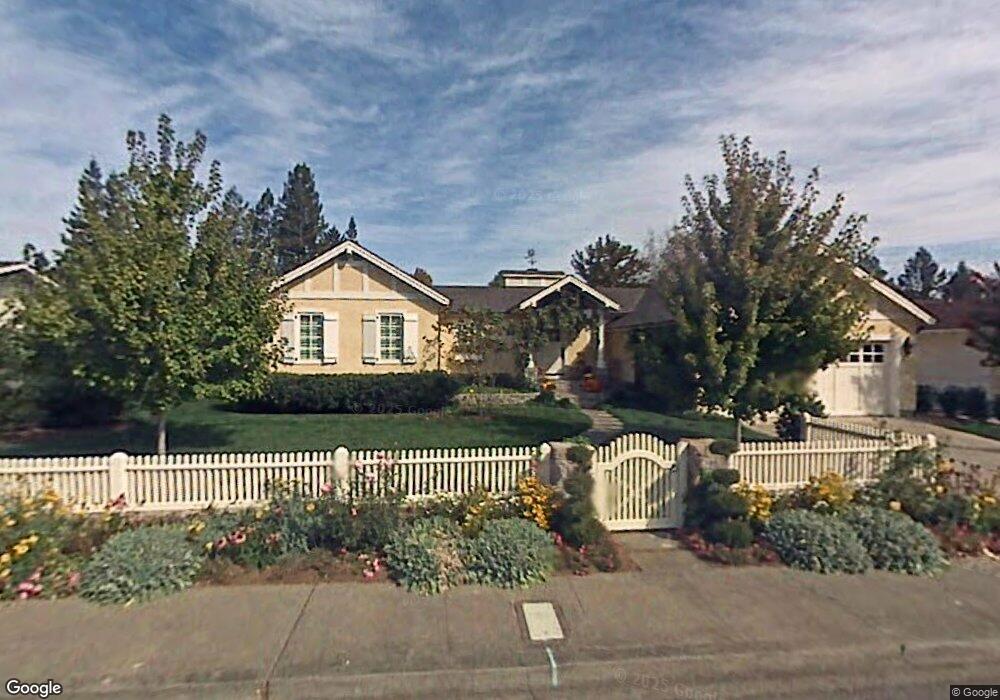
2588 Rollingwood Dr Napa, CA 94558
Browns Valley NeighborhoodEstimated Value: $1,054,000 - $1,222,000
3
Beds
3
Baths
1,947
Sq Ft
$586/Sq Ft
Est. Value
About This Home
This home is located at 2588 Rollingwood Dr, Napa, CA 94558 and is currently estimated at $1,141,762, approximately $586 per square foot. 2588 Rollingwood Dr is a home located in Napa County with nearby schools including West Park Elementary School, Redwood Middle School, and Napa High School.
Ownership History
Date
Name
Owned For
Owner Type
Purchase Details
Closed on
Jan 3, 2018
Sold by
Schaper Donald W and Schaper Loretta J
Bought by
Schaper Donald W and Schaper Loretta J
Current Estimated Value
Purchase Details
Closed on
Aug 22, 2003
Sold by
Rowen Yukiko
Bought by
Schaper Donald W and Schaper Loretta J
Home Financials for this Owner
Home Financials are based on the most recent Mortgage that was taken out on this home.
Original Mortgage
$424,000
Outstanding Balance
$190,106
Interest Rate
5.87%
Mortgage Type
Purchase Money Mortgage
Estimated Equity
$951,656
Purchase Details
Closed on
Aug 9, 2000
Sold by
Rowen John D
Bought by
Rowen Yukiko
Purchase Details
Closed on
Jul 11, 1994
Sold by
Close Virginia L H and Close Robert H
Bought by
Rowen John D and Rowen Yukiko
Home Financials for this Owner
Home Financials are based on the most recent Mortgage that was taken out on this home.
Original Mortgage
$169,900
Interest Rate
4.62%
Create a Home Valuation Report for This Property
The Home Valuation Report is an in-depth analysis detailing your home's value as well as a comparison with similar homes in the area
Home Values in the Area
Average Home Value in this Area
Purchase History
| Date | Buyer | Sale Price | Title Company |
|---|---|---|---|
| Schaper Donald W | -- | None Available | |
| Schaper Donald W | $530,000 | Fidelity National Title Co | |
| Rowen Yukiko | -- | -- | |
| Rowen John D | -- | Napa Land Title Co |
Source: Public Records
Mortgage History
| Date | Status | Borrower | Loan Amount |
|---|---|---|---|
| Open | Schaper Donald W | $424,000 | |
| Previous Owner | Rowen John D | $169,900 |
Source: Public Records
Tax History Compared to Growth
Tax History
| Year | Tax Paid | Tax Assessment Tax Assessment Total Assessment is a certain percentage of the fair market value that is determined by local assessors to be the total taxable value of land and additions on the property. | Land | Improvement |
|---|---|---|---|---|
| 2025 | $9,503 | $807,921 | $390,984 | $416,937 |
| 2024 | $9,503 | $792,080 | $383,318 | $408,762 |
| 2023 | $9,503 | $776,550 | $375,802 | $400,748 |
| 2022 | $9,213 | $761,325 | $368,434 | $392,891 |
| 2021 | $9,084 | $746,398 | $361,210 | $385,188 |
| 2020 | $9,017 | $738,746 | $357,507 | $381,239 |
| 2019 | $8,833 | $724,262 | $350,498 | $373,764 |
| 2018 | $8,720 | $710,062 | $343,626 | $366,436 |
| 2017 | $8,551 | $696,140 | $336,889 | $359,251 |
| 2016 | $8,404 | $682,491 | $330,284 | $352,207 |
| 2015 | $7,875 | $672,240 | $325,323 | $346,917 |
| 2014 | $7,757 | $659,073 | $318,951 | $340,122 |
Source: Public Records
Map
Nearby Homes
- 1565 Baywood Ln
- 2470 W Pueblo Ave
- 1135 Pinewood Dr
- 3371 Crystal Ct
- 2520 Macmillan St
- 1125 Westview Dr
- 2510 Redwood Rd
- 2300 W Park Ave
- 3337 Kensington Cir
- 3350 Linda Vista Ave
- 35 Forest Ln
- 2131 W Pueblo Ave
- 1342 Norma Dr
- 1145 W Pueblo Place
- 3583 Jomar Dr
- 3344 Linda Mesa Way
- 1091 Century Dr
- 1476 Thomas Dr
- 1019 Westview Dr
- 100 Waterstone Ct
- 2580 Rollingwood Dr
- 2994 Pinewood Dr
- 2587 W Pueblo Ave
- 2575 W Pueblo Ave
- 2990 Pinewood Dr
- 2589 Rollingwood Dr
- 2572 Rollingwood Dr
- 2952 Pinewood Dr
- 2581 Rollingwood Dr
- 2563 W Pueblo Ave
- 2573 Rollingwood Dr
- 2995 Pinewood Dr
- 2564 Rollingwood Dr
- 2965 Pinewood Dr
- 2934 Pinewood Dr
- 2557 W Pueblo Ave
- 2565 Rollingwood Dr
- 2564 W Pueblo Ave
- 2949 Pinewood Dr
- 2588 Teakwood Ct