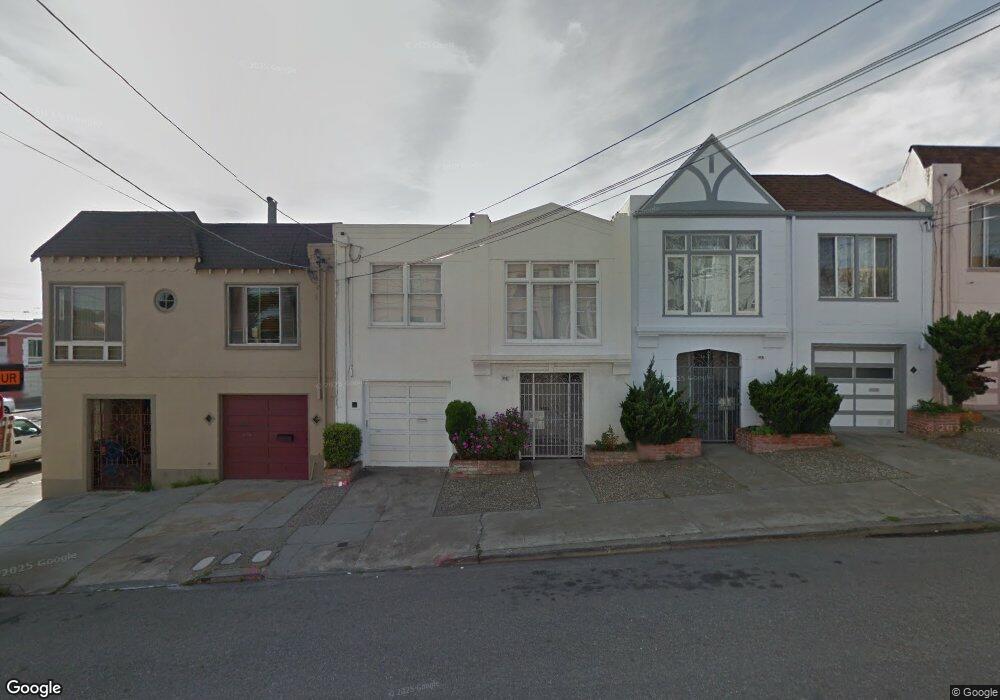
2591 38th Ave San Francisco, CA 94116
Outer Parkside NeighborhoodEstimated Value: $1,003,000 - $1,353,000
2
Beds
1
Bath
800
Sq Ft
$1,415/Sq Ft
Est. Value
About This Home
This home is located at 2591 38th Ave, San Francisco, CA 94116 and is currently estimated at $1,131,618, approximately $1,414 per square foot. 2591 38th Ave is a home located in San Francisco County with nearby schools including Ulloa Elementary School, Hoover (Herbert) Middle School, and St. Gabriel School.
Ownership History
Date
Name
Owned For
Owner Type
Purchase Details
Closed on
Nov 5, 2022
Sold by
Truong Dat Tai and Truong Tracy C
Bought by
Dat Tai Truong And Tracy C H Lau Revocable Tr
Current Estimated Value
Purchase Details
Closed on
Mar 5, 2013
Sold by
Lee Edmond
Bought by
Lee Edmond and Truong Dal Tai
Purchase Details
Closed on
Feb 19, 2008
Sold by
Lee Katie So Kuen
Bought by
Lee Edmond
Purchase Details
Closed on
Sep 15, 2003
Sold by
Lee Edmond and Lee Katie So Kuen
Bought by
Lee Edmond and Lee Katie So Kuen
Home Financials for this Owner
Home Financials are based on the most recent Mortgage that was taken out on this home.
Original Mortgage
$210,000
Interest Rate
6.3%
Mortgage Type
Purchase Money Mortgage
Purchase Details
Closed on
Jul 21, 1997
Sold by
Lee Jimmy H and Lee Katie S
Bought by
Lee Jimmy H and Lee Katie So Kuen
Create a Home Valuation Report for This Property
The Home Valuation Report is an in-depth analysis detailing your home's value as well as a comparison with similar homes in the area
Home Values in the Area
Average Home Value in this Area
Purchase History
| Date | Buyer | Sale Price | Title Company |
|---|---|---|---|
| Dat Tai Truong And Tracy C H Lau Revocable Tr | -- | -- | |
| Truong Dat Tai | -- | -- | |
| Lee Edmond | $185,000 | None Available | |
| Lee Edmond | -- | None Available | |
| Lee Edmond | -- | Chicago Title Company | |
| Lee Jimmy H | -- | -- |
Source: Public Records
Mortgage History
| Date | Status | Borrower | Loan Amount |
|---|---|---|---|
| Previous Owner | Lee Edmond | $210,000 |
Source: Public Records
Tax History Compared to Growth
Tax History
| Year | Tax Paid | Tax Assessment Tax Assessment Total Assessment is a certain percentage of the fair market value that is determined by local assessors to be the total taxable value of land and additions on the property. | Land | Improvement |
|---|---|---|---|---|
| 2025 | $7,375 | $573,462 | $389,358 | $184,104 |
| 2024 | $7,375 | $562,219 | $381,724 | $180,495 |
| 2023 | $7,257 | $551,197 | $374,240 | $176,957 |
| 2022 | $7,108 | $540,392 | $366,903 | $173,489 |
| 2021 | $6,979 | $529,798 | $359,710 | $170,088 |
| 2020 | $7,074 | $524,367 | $356,022 | $168,345 |
| 2019 | $6,787 | $514,088 | $349,042 | $165,046 |
| 2018 | $6,559 | $503,953 | $342,161 | $161,792 |
| 2017 | $6,184 | $494,074 | $335,453 | $158,621 |
| 2016 | $6,064 | $484,389 | $328,877 | $155,512 |
| 2015 | $5,988 | $477,115 | $323,938 | $153,177 |
| 2014 | $5,831 | $467,772 | $317,594 | $150,178 |
Source: Public Records
Map
Nearby Homes
- 2225 Vicente St Unit 1
- 2225 Vicente St
- 3400 Vicente St
- 2278 39th Ave
- 2687 45th Ave
- 2555 31st Ave
- 2032 Wawona St
- 2275 35th Ave
- 2139 Taraval St
- 2466 31st Ave
- 3535 Wawona St Unit 431
- 396 Crestlake Dr
- 2306 32nd Ave
- 2326 46th Ave
- 2391-2393 30th Ave
- 1927 Taraval St
- 74 Everglade Dr
- 2170 43rd Ave
- 2142 43rd Ave
- 2262 47th Ave
- 2587 38th Ave
- 2595 38th Ave
- 2716 Vicente St
- 2583 38th Ave
- 2722 Vicente St
- 2579 38th Ave
- 2575 38th Ave
- 2734 Vicente St
- 2590 38th Ave Unit 2692
- 2701 Vicente St
- 2586 38th Ave Unit 2588
- 2571 38th Ave
- 2646 Vicente St Unit 2650
- 2582 38th Ave Unit 2584
- 2740 Vicente St
- 2607 38th Ave
- 2567 38th Ave
- 2578 39th Ave
- 2638 Vicente St
- 2719 Vicente St