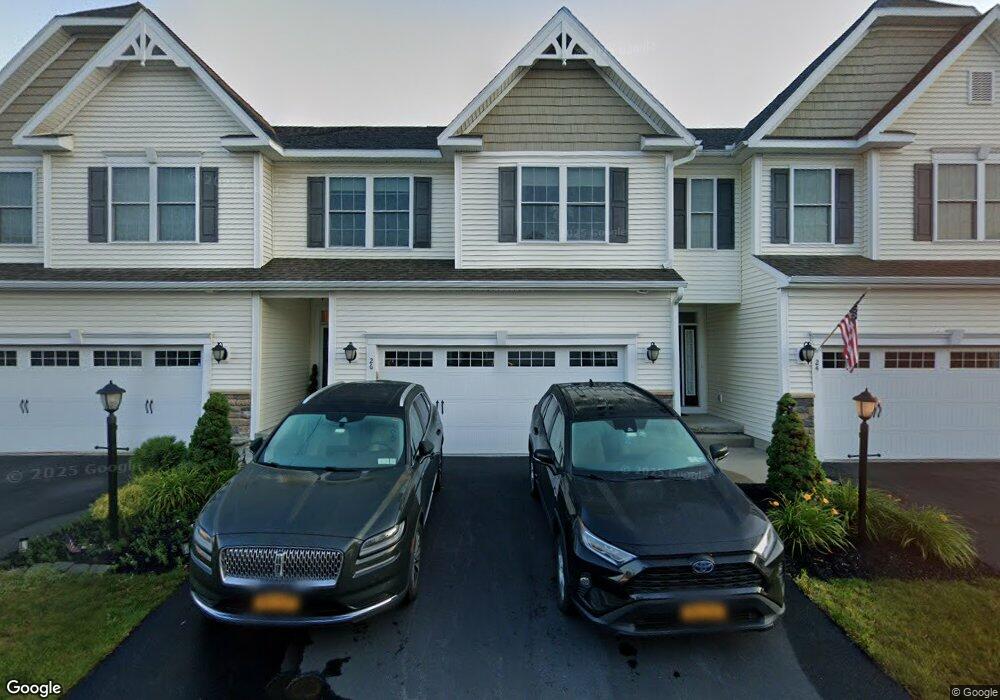
26 Andriana Ln Albany, NY 12204
North Albany-Shaker Park NeighborhoodEstimated Value: $434,000 - $481,000
3
Beds
3
Baths
1,756
Sq Ft
$263/Sq Ft
Est. Value
About This Home
This home is located at 26 Andriana Ln, Albany, NY 12204 and is currently estimated at $461,895, approximately $263 per square foot. 26 Andriana Ln is a home located in Albany County with nearby schools including North Albany Middle School, North Albany Academy Middle School, and Stephen And Harriet Myers Middle School.
Ownership History
Date
Name
Owned For
Owner Type
Purchase Details
Closed on
Mar 18, 2016
Sold by
Amedore Homes Inc
Bought by
Caplan Ariana
Current Estimated Value
Home Financials for this Owner
Home Financials are based on the most recent Mortgage that was taken out on this home.
Original Mortgage
$234,793
Outstanding Balance
$185,838
Interest Rate
3.65%
Mortgage Type
New Conventional
Estimated Equity
$276,057
Create a Home Valuation Report for This Property
The Home Valuation Report is an in-depth analysis detailing your home's value as well as a comparison with similar homes in the area
Home Values in the Area
Average Home Value in this Area
Purchase History
| Date | Buyer | Sale Price | Title Company |
|---|---|---|---|
| Caplan Ariana | $293,042 | None Available |
Source: Public Records
Mortgage History
| Date | Status | Borrower | Loan Amount |
|---|---|---|---|
| Open | Caplan Ariana | $234,793 |
Source: Public Records
Tax History Compared to Growth
Tax History
| Year | Tax Paid | Tax Assessment Tax Assessment Total Assessment is a certain percentage of the fair market value that is determined by local assessors to be the total taxable value of land and additions on the property. | Land | Improvement |
|---|---|---|---|---|
| 2024 | $10,017 | $389,000 | $77,800 | $311,200 |
| 2023 | $11,640 | $293,000 | $52,300 | $240,700 |
| 2022 | $11,383 | $293,000 | $52,300 | $240,700 |
| 2021 | $11,357 | $293,000 | $52,300 | $240,700 |
| 2020 | $11,117 | $293,000 | $52,300 | $240,700 |
| 2019 | $11,535 | $293,000 | $52,300 | $240,700 |
| 2018 | $11,143 | $293,000 | $52,300 | $240,700 |
| 2017 | $1,452 | $293,000 | $52,300 | $240,700 |
| 2016 | $3,688 | $100,000 | $52,300 | $47,700 |
Source: Public Records
Map
Nearby Homes