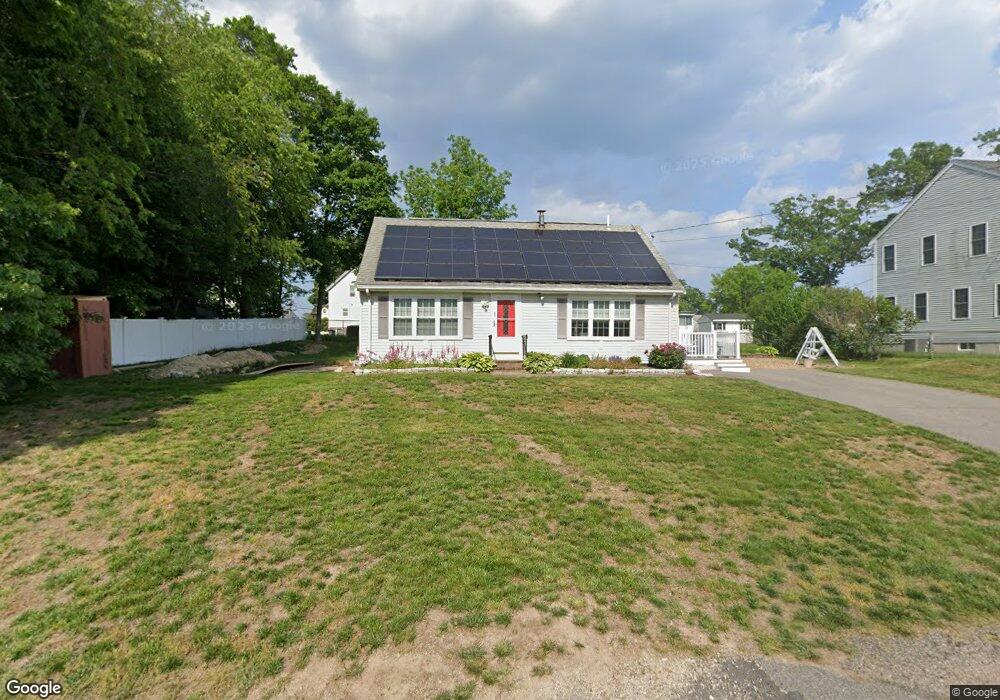
26 Dunbar St Brockton, MA 02302
Campello NeighborhoodEstimated Value: $516,000 - $539,000
3
Beds
2
Baths
1,008
Sq Ft
$524/Sq Ft
Est. Value
About This Home
This home is located at 26 Dunbar St, Brockton, MA 02302 and is currently estimated at $528,570, approximately $524 per square foot. 26 Dunbar St is a home located in Plymouth County with nearby schools including Davis K-8 School, John F. Kennedy Elementary School, and South Middle School.
Ownership History
Date
Name
Owned For
Owner Type
Purchase Details
Closed on
Aug 14, 2003
Sold by
Lusardi Kelly A
Bought by
Golb Steven H and Golb Michelle
Current Estimated Value
Home Financials for this Owner
Home Financials are based on the most recent Mortgage that was taken out on this home.
Original Mortgage
$199,920
Interest Rate
5.46%
Mortgage Type
Purchase Money Mortgage
Purchase Details
Closed on
Jan 29, 1998
Sold by
Fnma
Bought by
Lusardi Emmanual E and Lusardi Kelly A
Purchase Details
Closed on
Oct 9, 1996
Sold by
Ezeigwe Godfrey O
Bought by
Federal National Mortgage Association
Create a Home Valuation Report for This Property
The Home Valuation Report is an in-depth analysis detailing your home's value as well as a comparison with similar homes in the area
Home Values in the Area
Average Home Value in this Area
Purchase History
| Date | Buyer | Sale Price | Title Company |
|---|---|---|---|
| Golb Steven H | $249,900 | -- | |
| Lusardi Emmanual E | $101,000 | -- | |
| Federal National Mortgage Association | $124,888 | -- |
Source: Public Records
Mortgage History
| Date | Status | Borrower | Loan Amount |
|---|---|---|---|
| Open | Federal National Mortgage Association | $179,870 | |
| Closed | Federal National Mortgage Association | $25,000 | |
| Closed | Federal National Mortgage Association | $199,920 |
Source: Public Records
Tax History Compared to Growth
Tax History
| Year | Tax Paid | Tax Assessment Tax Assessment Total Assessment is a certain percentage of the fair market value that is determined by local assessors to be the total taxable value of land and additions on the property. | Land | Improvement |
|---|---|---|---|---|
| 2025 | $5,218 | $430,900 | $164,300 | $266,600 |
| 2024 | $4,915 | $408,900 | $164,300 | $244,600 |
| 2023 | $4,816 | $371,000 | $114,800 | $256,200 |
| 2022 | $4,799 | $343,500 | $104,400 | $239,100 |
| 2021 | $4,256 | $293,500 | $98,200 | $195,300 |
| 2020 | $4,404 | $290,700 | $85,600 | $205,100 |
| 2019 | $4,211 | $271,000 | $82,300 | $188,700 |
| 2018 | $3,928 | $244,600 | $82,300 | $162,300 |
| 2017 | $3,679 | $228,500 | $82,300 | $146,200 |
| 2016 | $3,611 | $208,000 | $78,400 | $129,600 |
| 2015 | $3,425 | $188,700 | $78,400 | $110,300 |
| 2014 | $3,476 | $191,700 | $78,400 | $113,300 |
Source: Public Records
Map
Nearby Homes