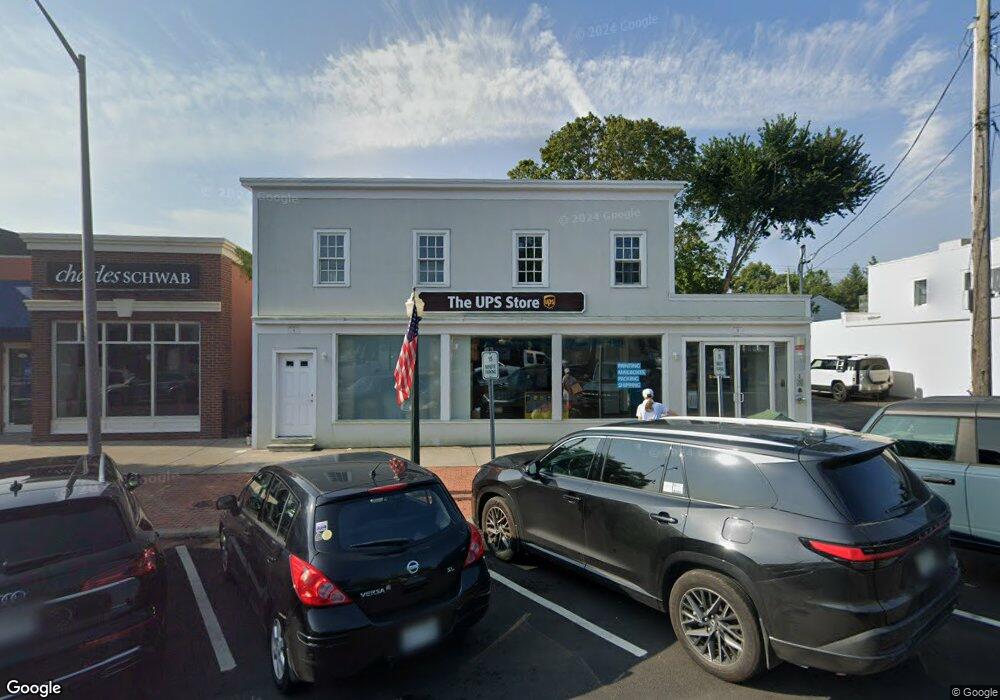
26 Hill St Southampton, NY 11968
Estimated Value: $2,472,000
--
Bed
--
Bath
2,240
Sq Ft
$1,104/Sq Ft
Est. Value
About This Home
This home is located at 26 Hill St, Southampton, NY 11968 and is currently estimated at $2,472,000, approximately $1,103 per square foot. 26 Hill St is a home located in Suffolk County with nearby schools including Southampton Elementary School, Southampton Intermediate School, and Southampton High School.
Ownership History
Date
Name
Owned For
Owner Type
Purchase Details
Closed on
Sep 3, 2024
Sold by
Didricket Dana
Bought by
Shoji 849 Hayground Llc
Current Estimated Value
Purchase Details
Closed on
Jan 3, 2018
Sold by
Mcmanus Rhoda and Mcmanus James L
Bought by
Surf Holdings 1 Llc
Home Financials for this Owner
Home Financials are based on the most recent Mortgage that was taken out on this home.
Original Mortgage
$962,500
Interest Rate
3.94%
Mortgage Type
Purchase Money Mortgage
Create a Home Valuation Report for This Property
The Home Valuation Report is an in-depth analysis detailing your home's value as well as a comparison with similar homes in the area
Home Values in the Area
Average Home Value in this Area
Purchase History
| Date | Buyer | Sale Price | Title Company |
|---|---|---|---|
| Shoji 849 Hayground Llc | $425,000 | None Available | |
| Shoji 849 Hayground Llc | $425,000 | None Available | |
| Surf Holdings 1 Llc | $1,375,000 | -- | |
| Surf Holdings 1 Llc | $1,375,000 | -- | |
| Surf Holdings 1 Llc | $1,375,000 | -- | |
| Surf Holdings 1 Llc | $1,375,000 | -- |
Source: Public Records
Mortgage History
| Date | Status | Borrower | Loan Amount |
|---|---|---|---|
| Previous Owner | Surf Holdings 1 Llc | $962,500 |
Source: Public Records
Tax History Compared to Growth
Tax History
| Year | Tax Paid | Tax Assessment Tax Assessment Total Assessment is a certain percentage of the fair market value that is determined by local assessors to be the total taxable value of land and additions on the property. | Land | Improvement |
|---|---|---|---|---|
| 2024 | $2,560 | $1,686,400 | $565,300 | $1,121,100 |
| 2023 | $2,560 | $1,686,400 | $565,300 | $1,121,100 |
| 2022 | $7,254 | $1,686,400 | $565,300 | $1,121,100 |
| 2021 | $7,254 | $1,686,400 | $565,300 | $1,121,100 |
| 2020 | $6,169 | $1,686,400 | $565,300 | $1,121,100 |
| 2019 | $5,809 | $0 | $0 | $0 |
| 2018 | -- | $1,309,900 | $565,300 | $744,600 |
| 2017 | $5,045 | $1,670,000 | $565,300 | $1,104,700 |
| 2016 | $5,267 | $1,670,000 | $565,300 | $1,104,700 |
| 2015 | -- | $1,670,000 | $565,300 | $1,104,700 |
| 2014 | -- | $1,670,000 | $565,300 | $1,104,700 |
Source: Public Records
Map
Nearby Homes