
Seller's Agent in 2019
Brian Wood
Cross Davidson Real Estate
(618) 201-9509
149 Total Sales
Estimated Value: $181,000 - $196,850
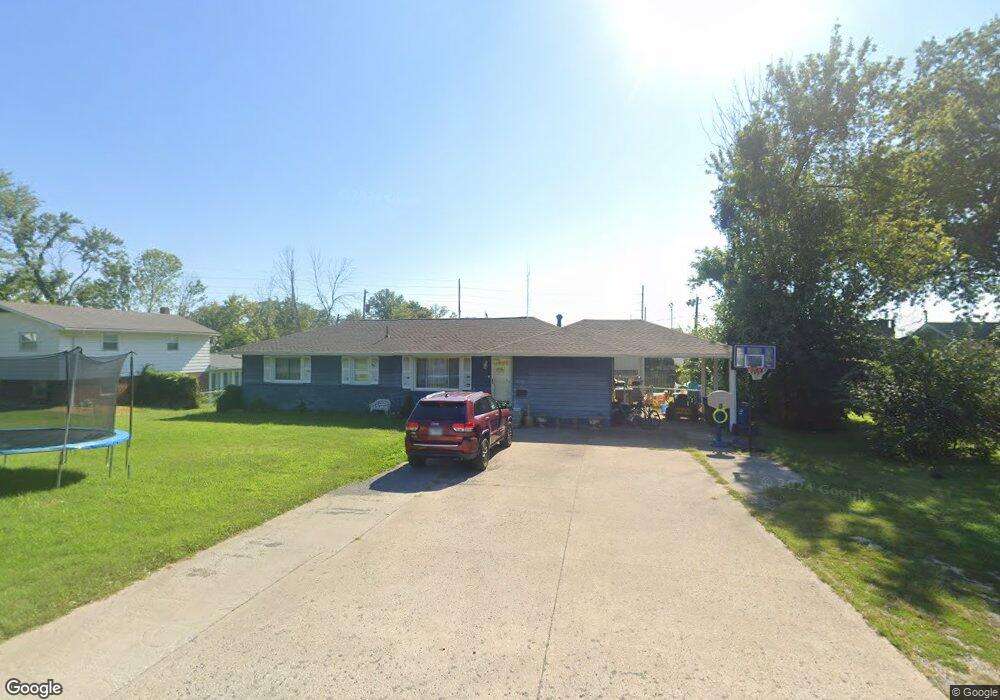
Nestled into a corner of N Highland this north side location has convenience for road and retail access. The 3 bedroom and 2 bath home has Mid-Century influences mixed with modern updates. A new metal roof, new gutters, siding, soffitts and fascia give this home a welcome face lift. The large Living Room has vaulted ceilings with exposed beams, a fireplace and is lined with windows looking onto the rear patio. Pass through the Dining Room and into the massive eat-in Kitchen. Even with two islands and a good amount of cabinets there is still room for a dining table fit for a feast. The three bedrooms are typical in size and retain elements of previous style. The bathrooms have received nice updates. There is a one and one-half attached carport. The south side of the lot is 30' vac alley. Kitchen appliances
| Date | Buyer | Sale Price | Title Company |
|---|---|---|---|
| Chrum Randall K | $126,750 | None Available |
| Date | Status | Borrower | Loan Amount |
|---|---|---|---|
| Open | Chrum Randall K | $91,200 |
| Date | Event | Price | List to Sale | Price per Sq Ft | Prior Sale |
|---|---|---|---|---|---|
| 03/13/2019 03/13/19 | Sold | $68,500 | -2.0% | $35 / Sq Ft | View Prior Sale |
| 02/13/2019 02/13/19 | Pending | -- | -- | -- | |
| 01/14/2019 01/14/19 | For Sale | $69,900 | +323.6% | $36 / Sq Ft | |
| 12/29/2016 12/29/16 | Sold | $16,500 | -70.0% | $9 / Sq Ft | View Prior Sale |
| 12/22/2016 12/22/16 | Pending | -- | -- | -- | |
| 09/16/2016 09/16/16 | For Sale | $55,000 | -34.9% | $28 / Sq Ft | |
| 09/20/2013 09/20/13 | Sold | $84,500 | 0.0% | $34 / Sq Ft | View Prior Sale |
| 08/01/2013 08/01/13 | Pending | -- | -- | -- | |
| 07/30/2013 07/30/13 | For Sale | $84,500 | -- | $34 / Sq Ft |
| Year | Tax Paid | Tax Assessment Tax Assessment Total Assessment is a certain percentage of the fair market value that is determined by local assessors to be the total taxable value of land and additions on the property. | Land | Improvement |
|---|---|---|---|---|
| 2024 | $3,733 | $48,994 | $4,014 | $44,980 |
| 2023 | $3,420 | $45,231 | $3,706 | $41,525 |
| 2022 | $3,257 | $39,676 | $3,251 | $36,425 |
| 2021 | $3,081 | $37,786 | $3,096 | $34,690 |
| 2020 | $3,078 | $35,314 | $2,893 | $32,421 |
| 2019 | $3,036 | $35,314 | $2,893 | $32,421 |
| 2018 | $2,997 | $35,314 | $2,893 | $32,421 |
| 2017 | $2,930 | $35,314 | $2,893 | $32,421 |
| 2016 | $2,846 | $35,314 | $2,893 | $32,421 |
| 2015 | $2,784 | $35,314 | $2,893 | $32,421 |
| 2014 | $1,983 | $35,314 | $2,893 | $32,421 |
| 2013 | $1,983 | $33,315 | $2,729 | $30,586 |
Seller's Agent in 2019
Brian Wood
Cross Davidson Real Estate
(618) 201-9509
149 Total Sales
Seller's Agent in 2016
Sandra Sandweg
Keller Williams Pinnacle - MTV
(618) 204-5084
53 Total Sales
M
Seller's Agent in 2013
Marion Johnson
Cross Davidson Real Estate
K
Buyer's Agent in 2013
Krista Bradshaw
Cross Davidson Real Estate