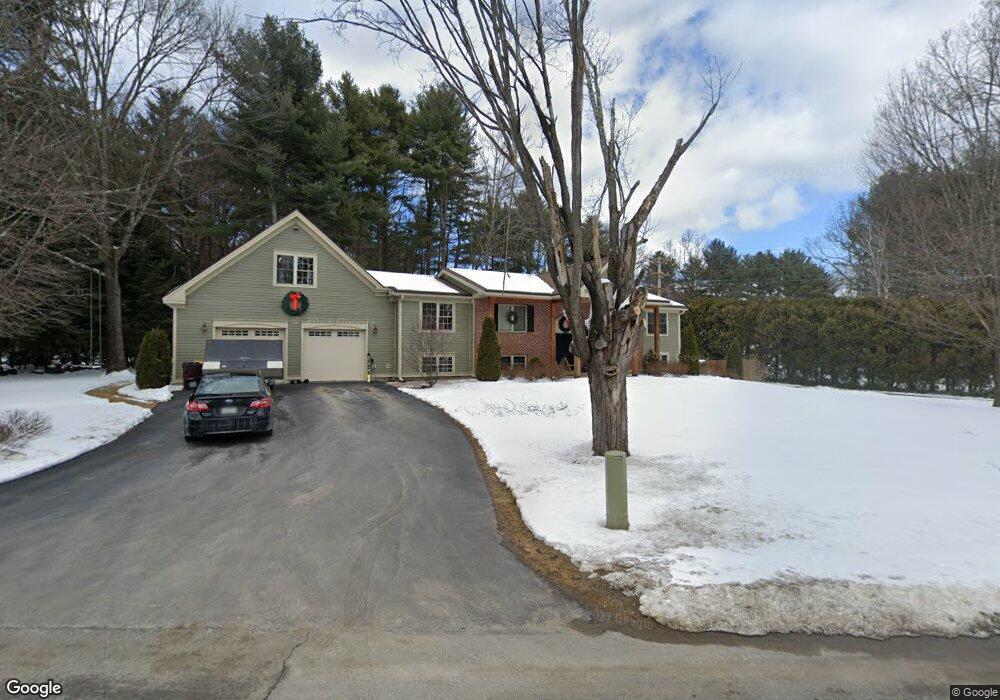
26 Wincrest Dr Queensbury, NY 12804
Glens Falls North NeighborhoodEstimated Value: $446,207 - $663,000
5
Beds
3
Baths
2,230
Sq Ft
$233/Sq Ft
Est. Value
About This Home
This home is located at 26 Wincrest Dr, Queensbury, NY 12804 and is currently estimated at $519,052, approximately $232 per square foot. 26 Wincrest Dr is a home located in Warren County with nearby schools including Queensbury Elementary School, William H. Barton Intermediate School, and Queensbury Middle School.
Ownership History
Date
Name
Owned For
Owner Type
Purchase Details
Closed on
Jul 26, 2012
Sold by
Raven Harold
Bought by
Raven Harold
Current Estimated Value
Home Financials for this Owner
Home Financials are based on the most recent Mortgage that was taken out on this home.
Original Mortgage
$250,000
Outstanding Balance
$178,799
Interest Rate
3.7%
Mortgage Type
Purchase Money Mortgage
Estimated Equity
$340,253
Purchase Details
Closed on
Dec 10, 2007
Sold by
Palangi Anthony J
Bought by
Raven Harold T
Purchase Details
Closed on
Oct 27, 1999
Sold by
Palangi Anthony J
Bought by
Palangi Anthony J and Le ,
Create a Home Valuation Report for This Property
The Home Valuation Report is an in-depth analysis detailing your home's value as well as a comparison with similar homes in the area
Home Values in the Area
Average Home Value in this Area
Purchase History
| Date | Buyer | Sale Price | Title Company |
|---|---|---|---|
| Raven Harold | -- | -- | |
| Raven Harold T | $206,000 | Sharon Freyer | |
| Palangi Anthony J | -- | -- |
Source: Public Records
Mortgage History
| Date | Status | Borrower | Loan Amount |
|---|---|---|---|
| Open | Raven Harold | $250,000 |
Source: Public Records
Tax History Compared to Growth
Tax History
| Year | Tax Paid | Tax Assessment Tax Assessment Total Assessment is a certain percentage of the fair market value that is determined by local assessors to be the total taxable value of land and additions on the property. | Land | Improvement |
|---|---|---|---|---|
| 2024 | $7,545 | $395,000 | $62,000 | $333,000 |
| 2023 | $7,181 | $308,500 | $52,000 | $256,500 |
| 2022 | $6,885 | $308,500 | $52,000 | $256,500 |
| 2021 | $6,791 | $308,500 | $52,000 | $256,500 |
| 2020 | $6,443 | $290,100 | $45,000 | $245,100 |
| 2019 | $4,159 | $290,100 | $45,000 | $245,100 |
| 2018 | $10,456 | $290,100 | $45,000 | $245,100 |
| 2017 | $10,306 | $281,800 | $45,000 | $236,800 |
| 2016 | $10,088 | $281,800 | $45,000 | $236,800 |
| 2015 | -- | $281,800 | $45,000 | $236,800 |
| 2014 | -- | $203,500 | $34,700 | $168,800 |
Source: Public Records
Map
Nearby Homes