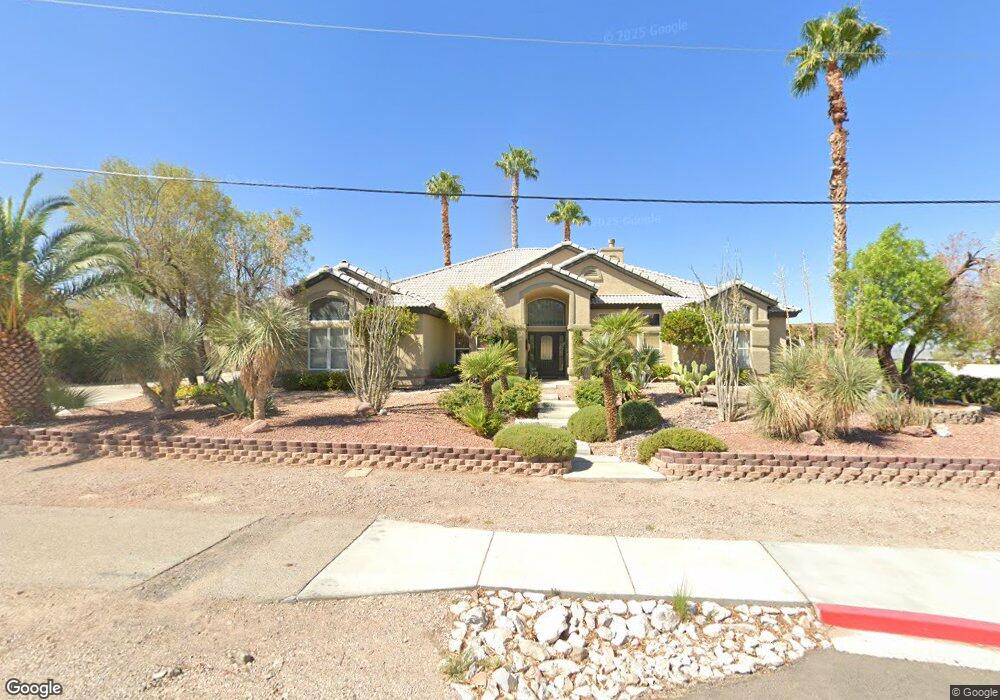
260 Cannes St Henderson, NV 89015
Foothills NeighborhoodEstimated Value: $706,878 - $786,000
4
Beds
3
Baths
2,900
Sq Ft
$262/Sq Ft
Est. Value
About This Home
This home is located at 260 Cannes St, Henderson, NV 89015 and is currently estimated at $760,970, approximately $262 per square foot. 260 Cannes St is a home located in Clark County with nearby schools including C T Sewell Elementary School, B Mahlon Brown Academy of International Studies, and Basic Academy of International Studies.
Ownership History
Date
Name
Owned For
Owner Type
Purchase Details
Closed on
Mar 17, 2020
Sold by
Boling Louis and Boling Virginia
Bought by
Boling Louis and Boling Virginia
Current Estimated Value
Purchase Details
Closed on
Jun 13, 2011
Sold by
Frazier Van W
Bought by
Boling Louis and Boling Virginia
Purchase Details
Closed on
Apr 21, 2010
Sold by
Frazier Van W and Frazier Pamela C
Bought by
Frazier Van W and Frazier Family Trust
Purchase Details
Closed on
Oct 27, 2006
Sold by
Frazier Van W and Frazier Pamela C
Bought by
Frazier Van W and Frazier Pamela C
Home Financials for this Owner
Home Financials are based on the most recent Mortgage that was taken out on this home.
Original Mortgage
$480,000
Interest Rate
6.62%
Mortgage Type
New Conventional
Purchase Details
Closed on
Oct 16, 2006
Sold by
Frazier Van W and Frazier Pamela C
Bought by
Frazier Van W and Frazier Pamela C
Home Financials for this Owner
Home Financials are based on the most recent Mortgage that was taken out on this home.
Original Mortgage
$480,000
Interest Rate
6.62%
Mortgage Type
New Conventional
Purchase Details
Closed on
Jul 24, 2000
Sold by
Frazier Van W and Frazier Pamela C
Bought by
Frazier Van W and Frazier Pamela C
Create a Home Valuation Report for This Property
The Home Valuation Report is an in-depth analysis detailing your home's value as well as a comparison with similar homes in the area
Home Values in the Area
Average Home Value in this Area
Purchase History
| Date | Buyer | Sale Price | Title Company |
|---|---|---|---|
| Boling Louis | -- | None Available | |
| Boling Louis | $230,000 | Ticor Title Las Vegas | |
| Frazier Van W | -- | None Available | |
| Frazier Van W | -- | National Alliance Title | |
| Frazier Van W | -- | National Alliance Title | |
| Frazier Van W | -- | -- |
Source: Public Records
Mortgage History
| Date | Status | Borrower | Loan Amount |
|---|---|---|---|
| Previous Owner | Frazier Van W | $480,000 |
Source: Public Records
Tax History Compared to Growth
Tax History
| Year | Tax Paid | Tax Assessment Tax Assessment Total Assessment is a certain percentage of the fair market value that is determined by local assessors to be the total taxable value of land and additions on the property. | Land | Improvement |
|---|---|---|---|---|
| 2025 | $3,101 | $154,699 | $52,500 | $102,199 |
| 2024 | $3,060 | $154,699 | $52,500 | $102,199 |
| 2023 | $3,060 | $149,310 | $52,500 | $96,810 |
| 2022 | $3,257 | $134,282 | $45,500 | $88,782 |
| 2021 | $3,016 | $126,637 | $42,000 | $84,637 |
| 2020 | $2,798 | $126,079 | $42,000 | $84,079 |
| 2019 | $2,622 | $114,505 | $31,500 | $83,005 |
| 2018 | $2,546 | $101,231 | $21,000 | $80,231 |
| 2017 | $2,974 | $102,600 | $21,000 | $81,600 |
| 2016 | $2,411 | $102,630 | $21,000 | $81,630 |
| 2015 | $2,406 | $90,494 | $14,000 | $76,494 |
| 2014 | $2,336 | $78,634 | $14,000 | $64,634 |
Source: Public Records
Map
Nearby Homes
- 304 Belfast St
- 308 Belfast St
- 0 Cannes St
- 263 Prairie Rose St
- 831 Purple Sage Terrace
- 242 Fullerton Ave
- 253 Kirk Ave
- 233 Mariposa Way
- 0 N Pueblo Blvd
- 259 Mojave Ln
- 218 Kirk Ave
- 216 Night Fall Terrace
- 914 Palo Verde Dr
- 915 N Major Ave
- 240 Navajo Dr
- 1009 Driftwood Ct
- 415 Emden St
- 900 Clipper Dr
- 209 Mojave Ln
- 237 Piute Ln