Estimated Value: $538,000 - $649,000
4
Beds
2
Baths
1,746
Sq Ft
$346/Sq Ft
Est. Value
About This Home
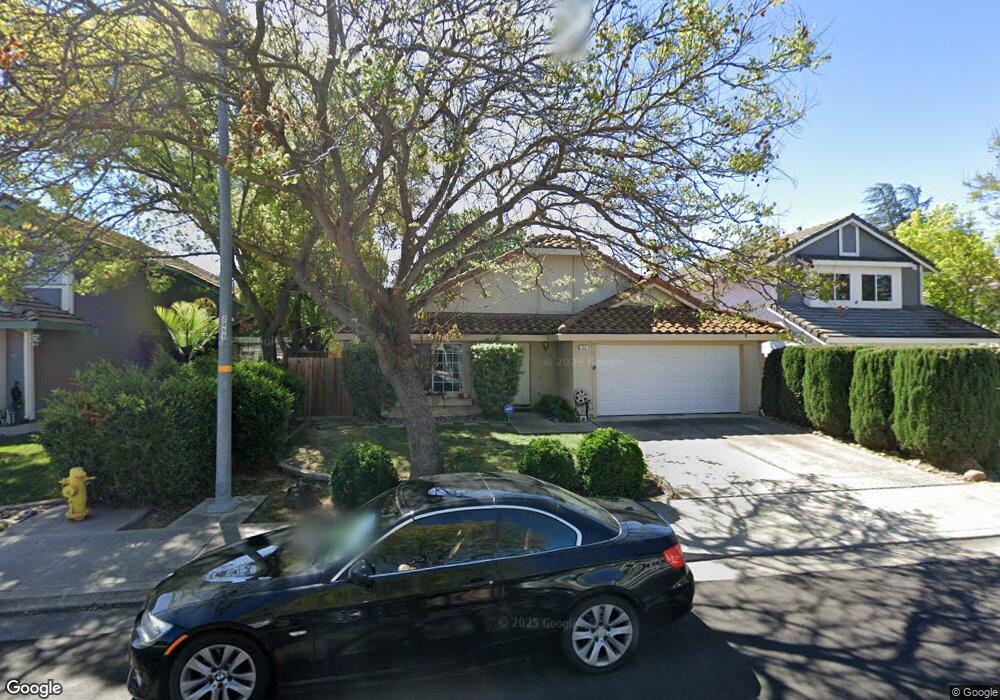
This home is located at 260 Orestimba Cir, Tracy, CA 95376 and is currently estimated at $604,172, approximately $346 per square foot. 260 Orestimba Cir is a home located in San Joaquin County with nearby schools including Louis A. Bohn Elementary School, Earle E. Williams Middle School, and Tracy High School.
Ownership History
Date
Name
Owned For
Owner Type
Purchase Details
Closed on
Apr 8, 2014
Sold by
Carson Virgil Lee and Carson Jacqueline Marie
Bought by
Carson Virgil L and Li Jacqueline M Carson
Current Estimated Value
Purchase Details
Closed on
Mar 11, 1998
Sold by
Ibarra Ronnie F
Bought by
Ibarra Rigoberto C and Ibarra Ronnie F
Home Financials for this Owner
Home Financials are based on the most recent Mortgage that was taken out on this home.
Original Mortgage
$134,400
Outstanding Balance
$24,587
Interest Rate
7.02%
Estimated Equity
$579,585
Purchase Details
Closed on
Dec 18, 1996
Sold by
Ibarra Rigoberto C
Bought by
Ibarra Ronnie F
Purchase Details
Closed on
Mar 15, 1994
Sold by
Bell Darin and Bell Lori
Bought by
Dunne Ronnie F
Home Financials for this Owner
Home Financials are based on the most recent Mortgage that was taken out on this home.
Original Mortgage
$130,700
Interest Rate
8.65%
Purchase Details
Closed on
Dec 29, 1993
Sold by
Haber Don
Bought by
Bell Darin and Bell Lori
Create a Home Valuation Report for This Property
The Home Valuation Report is an in-depth analysis detailing your home's value as well as a comparison with similar homes in the area
Home Values in the Area
Average Home Value in this Area
Purchase History
| Date | Buyer | Sale Price | Title Company |
|---|---|---|---|
| Carson Virgil L | -- | None Available | |
| Ibarra Rigoberto C | -- | First American Title Co | |
| Ibarra Ronnie F | -- | Old Republic Title Company | |
| Dunne Ronnie F | $163,500 | Chicago Title Company | |
| Bell Darin | $18,000 | -- |
Source: Public Records
Mortgage History
| Date | Status | Borrower | Loan Amount |
|---|---|---|---|
| Open | Ibarra Rigoberto C | $134,400 | |
| Previous Owner | Dunne Ronnie F | $130,700 |
Source: Public Records
Tax History Compared to Growth
Tax History
| Year | Tax Paid | Tax Assessment Tax Assessment Total Assessment is a certain percentage of the fair market value that is determined by local assessors to be the total taxable value of land and additions on the property. | Land | Improvement |
|---|---|---|---|---|
| 2025 | $5,161 | $435,630 | $129,992 | $305,638 |
| 2024 | $4,764 | $427,090 | $127,444 | $299,646 |
| 2023 | $4,686 | $418,717 | $124,946 | $293,771 |
| 2022 | $4,588 | $410,508 | $122,497 | $288,011 |
| 2021 | $4,529 | $402,460 | $120,096 | $282,364 |
| 2020 | $4,497 | $398,334 | $118,865 | $279,469 |
| 2019 | $4,423 | $390,525 | $116,535 | $273,990 |
| 2018 | $4,587 | $382,868 | $114,250 | $268,618 |
| 2017 | $4,372 | $375,361 | $112,010 | $263,351 |
| 2016 | $4,410 | $368,002 | $109,814 | $258,188 |
| 2015 | $3,948 | $325,000 | $97,000 | $228,000 |
| 2014 | $3,559 | $300,000 | $90,000 | $210,000 |
Source: Public Records
Map
Nearby Homes
- 55 Shakespear Ct
- 345 Pacheco Dr
- 331 Chukar Ct
- 320 Accipiter Ct
- 55 Carmel Way
- 60 W South St
- 145 Eureka Way
- 430 Czerny St
- 160 Mount Oso Ave
- 213 W South St
- 85 Phillips Ct
- 145 Machado Ct
- 56 Lavender Ct
- 8825 Janice Way
- 385 Cecelio Way
- 18 W 8th St
- 517 Rockingham Way
- 610 Tennis Ln
- 790 W Mount Diablo Ave
- 1891 S Central Ave
- 270 Orestimba Cir
- 250 Orestimba Cir
- 265 Tassajera Ct
- 280 Orestimba Cir
- 230 Orestimba Cir
- 275 Tassajera Ct
- 255 Tassajera Ct
- 235 Tassajera Ct
- 285 Tassajera Ct
- 265 Orestimba Cir
- 255 Orestimba Cir
- 275 Orestimba Cir
- 245 Orestimba Cir
- 285 Orestimba Cir
- 235 Orestimba Cir
- 260 Mount Hamilton Dr
- 260 Tassajera Ct
- 250 Mount Hamilton Dr
- 270 Mount Hamilton Dr
- 250 Tassajera Ct