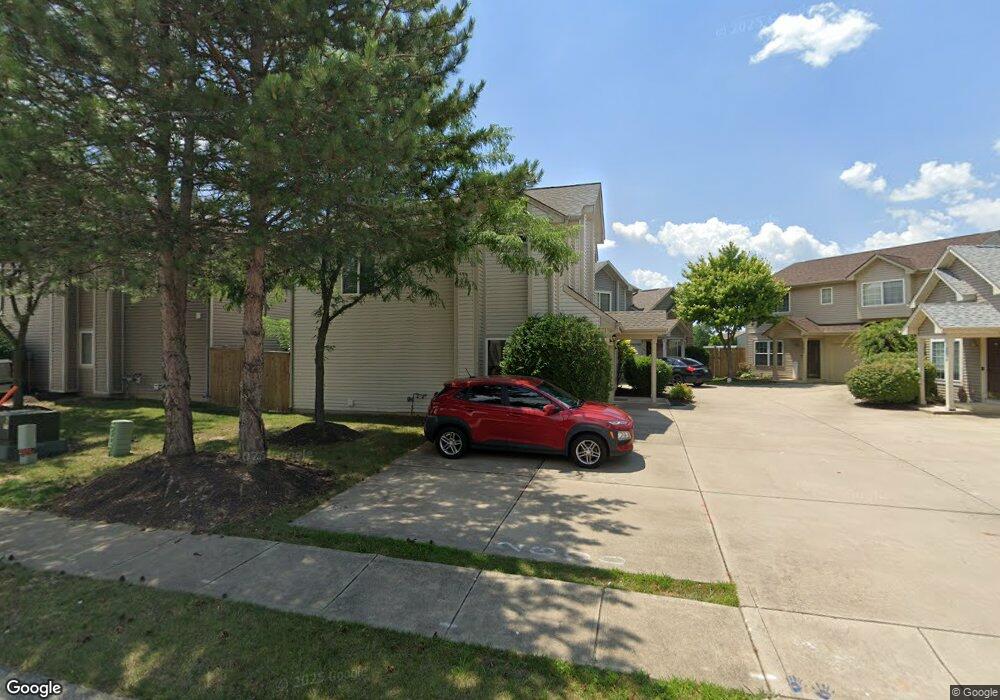
2600 Frasier Fir Dr Greenwood, IN 46143
Estimated Value: $206,000 - $233,000
2
Beds
2
Baths
1,167
Sq Ft
$185/Sq Ft
Est. Value
About This Home
This home is located at 2600 Frasier Fir Dr, Greenwood, IN 46143 and is currently estimated at $216,110, approximately $185 per square foot. 2600 Frasier Fir Dr is a home located in Johnson County with nearby schools including Pleasant Crossing Elementary School, Clark-Pleasant Middle School, and Whiteland Community High School.
Ownership History
Date
Name
Owned For
Owner Type
Purchase Details
Closed on
Dec 23, 2021
Sold by
Mott Eric C
Bought by
Dennis Rachel
Current Estimated Value
Home Financials for this Owner
Home Financials are based on the most recent Mortgage that was taken out on this home.
Original Mortgage
$179,450
Outstanding Balance
$164,758
Interest Rate
2.98%
Mortgage Type
New Conventional
Estimated Equity
$51,352
Purchase Details
Closed on
Mar 20, 2020
Sold by
Hattabaugh Patrick
Bought by
Mott Eric R
Home Financials for this Owner
Home Financials are based on the most recent Mortgage that was taken out on this home.
Original Mortgage
$123,226
Interest Rate
4.25%
Mortgage Type
FHA
Purchase Details
Closed on
Mar 13, 2007
Sold by
Arbor Homes Llc
Bought by
Hattabaugh Patrick
Home Financials for this Owner
Home Financials are based on the most recent Mortgage that was taken out on this home.
Original Mortgage
$86,920
Interest Rate
8.85%
Mortgage Type
Adjustable Rate Mortgage/ARM
Create a Home Valuation Report for This Property
The Home Valuation Report is an in-depth analysis detailing your home's value as well as a comparison with similar homes in the area
Home Values in the Area
Average Home Value in this Area
Purchase History
| Date | Buyer | Sale Price | Title Company |
|---|---|---|---|
| Dennis Rachel | -- | None Available | |
| Mott Eric R | $125,500 | Chicago Title | |
| Hattabaugh Patrick | -- | None Available |
Source: Public Records
Mortgage History
| Date | Status | Borrower | Loan Amount |
|---|---|---|---|
| Open | Dennis Rachel | $179,450 | |
| Previous Owner | Mott Eric R | $123,226 | |
| Previous Owner | Hattabaugh Patrick | $86,920 |
Source: Public Records
Tax History Compared to Growth
Tax History
| Year | Tax Paid | Tax Assessment Tax Assessment Total Assessment is a certain percentage of the fair market value that is determined by local assessors to be the total taxable value of land and additions on the property. | Land | Improvement |
|---|---|---|---|---|
| 2025 | $2,044 | $203,100 | $41,100 | $162,000 |
| 2024 | $2,044 | $196,200 | $41,100 | $155,100 |
| 2023 | $2,204 | $176,800 | $41,100 | $135,700 |
| 2022 | $1,707 | $164,700 | $36,000 | $128,700 |
| 2021 | $1,242 | $120,000 | $26,000 | $94,000 |
| 2020 | $1,041 | $104,400 | $26,000 | $78,400 |
| 2019 | $898 | $95,700 | $10,200 | $85,500 |
| 2018 | $868 | $90,800 | $9,000 | $81,800 |
| 2017 | $851 | $91,400 | $9,000 | $82,400 |
| 2016 | $593 | $86,100 | $9,000 | $77,100 |
| 2014 | $531 | $76,600 | $17,300 | $59,300 |
| 2013 | $531 | $76,300 | $17,300 | $59,000 |
Source: Public Records
Map
Nearby Homes
- 577 Stobus Dr
- 2400 Grand Fir Dr
- 2357 Grand Fir Dr
- 767 Mountain Pine Dr
- 2916 Lodgepole Dr
- 700 Mountain Pine Dr
- 2284 Blossom Dr
- 389 Springfield Cir
- 0 W Worthsville Rd
- 2489 Wildflower Ln
- 2545 Wildflower Ln
- 814 Cherry Tree Ln
- 3196 Underwood Dr
- 671 Day Break Dr
- 2525 Summerwood Ln
- 2418 Ashton Ln
- 2277 Maple Stone Ln
- 955 Garrison Dr
- 2350 Harvest Moon Dr
- 1986 Mccormick Dr
- 2600 Fraiser Fir Dr
- 2616 Fraiser Fir Dr
- 2608 Fraiser Fir Dr
- 2624 Fraiser Fir Dr
- 2584 Fraiser Fir Dr
- 2592 Fraiser Fir Dr
- 2632 Fraiser Fir Dr
- 2640 Fraiser Fir Dr
- 2603 Fraiser Fir Dr
- 2619 Fraiser Fir Dr
- 611 Pine Lake Dr
- 2587 Fraiser Fir Dr
- 2648 Fraiser Fir Dr
- 2635 Faiser Fir Dr
- 2635 Fraiser Fir Dr
- 2656 Fraiser Fir Dr
- 627 Pine Lake Dr
- 2611 Fraiser Fir Dr
- 2627 Fraiser Fir Dr
- 2595 Fraiser Fir Dr