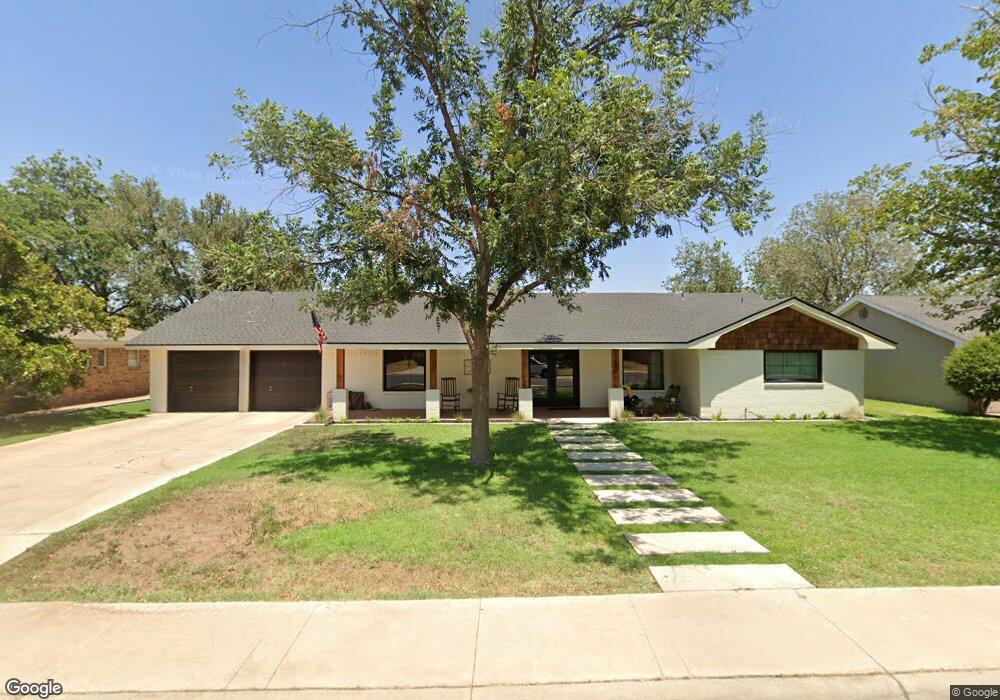
2600 W Dengar Ave Midland, TX 79705
Fannin Terrace NeighborhoodEstimated Value: $398,000 - $446,000
3
Beds
3
Baths
2,625
Sq Ft
$160/Sq Ft
Est. Value
About This Home
This home is located at 2600 W Dengar Ave, Midland, TX 79705 and is currently estimated at $420,163, approximately $160 per square foot. 2600 W Dengar Ave is a home located in Midland County with nearby schools including Fannin Elementary School, San Jacinto Junior High School, and Midland High School.
Ownership History
Date
Name
Owned For
Owner Type
Purchase Details
Closed on
Mar 29, 2022
Sold by
Marcus Dingler Iv William
Bought by
Doan Kyle Avery and Doan Sasra Rhian
Current Estimated Value
Home Financials for this Owner
Home Financials are based on the most recent Mortgage that was taken out on this home.
Original Mortgage
$342,400
Outstanding Balance
$319,338
Interest Rate
3.92%
Mortgage Type
New Conventional
Estimated Equity
$100,825
Purchase Details
Closed on
Aug 26, 2021
Sold by
Investidom Llc
Bought by
Dingler William M
Purchase Details
Closed on
Aug 25, 2021
Sold by
Piper Valerie S
Bought by
Investidom Llc
Purchase Details
Closed on
Mar 2, 2006
Sold by
Espe Lisa M and Todd Espe B
Bought by
Piper Valerie S
Purchase Details
Closed on
Jul 12, 2002
Sold by
Howard Danny J
Bought by
Piper Valerie Sax
Purchase Details
Closed on
Dec 6, 1982
Bought by
Piper Valerie Sax
Create a Home Valuation Report for This Property
The Home Valuation Report is an in-depth analysis detailing your home's value as well as a comparison with similar homes in the area
Home Values in the Area
Average Home Value in this Area
Purchase History
| Date | Buyer | Sale Price | Title Company |
|---|---|---|---|
| Doan Kyle Avery | -- | Corporation Service | |
| Dingler William M | -- | First American Title | |
| Investidom Llc | -- | First American Title | |
| Piper Valerie S | -- | Lone Star Abstarct & Title C | |
| Piper Valerie Sax | -- | -- | |
| Piper Valerie Sax | -- | -- |
Source: Public Records
Mortgage History
| Date | Status | Borrower | Loan Amount |
|---|---|---|---|
| Open | Doan Kyle Avery | $342,400 |
Source: Public Records
Tax History Compared to Growth
Tax History
| Year | Tax Paid | Tax Assessment Tax Assessment Total Assessment is a certain percentage of the fair market value that is determined by local assessors to be the total taxable value of land and additions on the property. | Land | Improvement |
|---|---|---|---|---|
| 2025 | $4,160 | $344,700 | $25,140 | $319,560 |
| 2024 | $4,167 | $353,500 | $25,140 | $328,360 |
| 2023 | $3,960 | $343,700 | $25,140 | $318,560 |
| 2022 | $4,449 | $313,180 | $25,140 | $288,040 |
| 2021 | $4,510 | $258,880 | $25,140 | $233,740 |
| 2020 | $4,499 | $259,600 | $25,140 | $234,460 |
| 2019 | $4,915 | $259,600 | $25,140 | $234,460 |
| 2018 | $4,822 | $248,000 | $25,140 | $222,860 |
| 2017 | $4,516 | $232,280 | $25,140 | $207,140 |
| 2016 | $4,423 | $235,090 | $25,140 | $209,950 |
| 2015 | -- | $233,020 | $25,140 | $219,250 |
| 2014 | -- | $225,790 | $25,140 | $200,650 |
Source: Public Records
Map
Nearby Homes
- 2601 W Dengar Ave
- 2502 Frontier Dr
- 2800 Cimmaron Ave
- 2605 Inwood Ct
- 2400 W Dengar Ave
- 63 Ironwood Ct Unit 91
- 63 Ironwood Ct
- 4 Amhurst Ct
- 2305 W Shandon Ave
- 3 Marinor Ct
- 2515 Neely Ave
- 2824 Cimmaron Ave
- 2603 Hughes St
- 2500 Seaboard Ave
- 2401 Dartmouth Dr
- 2503 Seaboard Ave
- 3304 Whitney Dr
- 3204 Cimmaron Ave
- 3200 W Wadley Ave
- 19 Winchester Ct
- 2602 W Dengar Ave
- 2512 W Dengar Ave
- 2601 W Shandon Ave
- 2513 W Shandon Ave
- 2603 W Shandon Ave
- 2604 W Dengar Ave
- 2510 W Dengar Ave
- 2603 W Dengar Ave
- 2513 W Dengar Ave
- 2605 W Shandon Ave
- 2511 W Shandon Ave
- 2605 W Dengar Ave
- 2511 W Dengar Ave
- 2508 W Dengar Ave
- 2606 W Dengar Ave
- 2600 W Shandon Ave
- 2602 Cimmaron Ave
- 2600 Cimmaron Ave
- 2512 W Shandon Ave
- 2607 W Shandon Ave