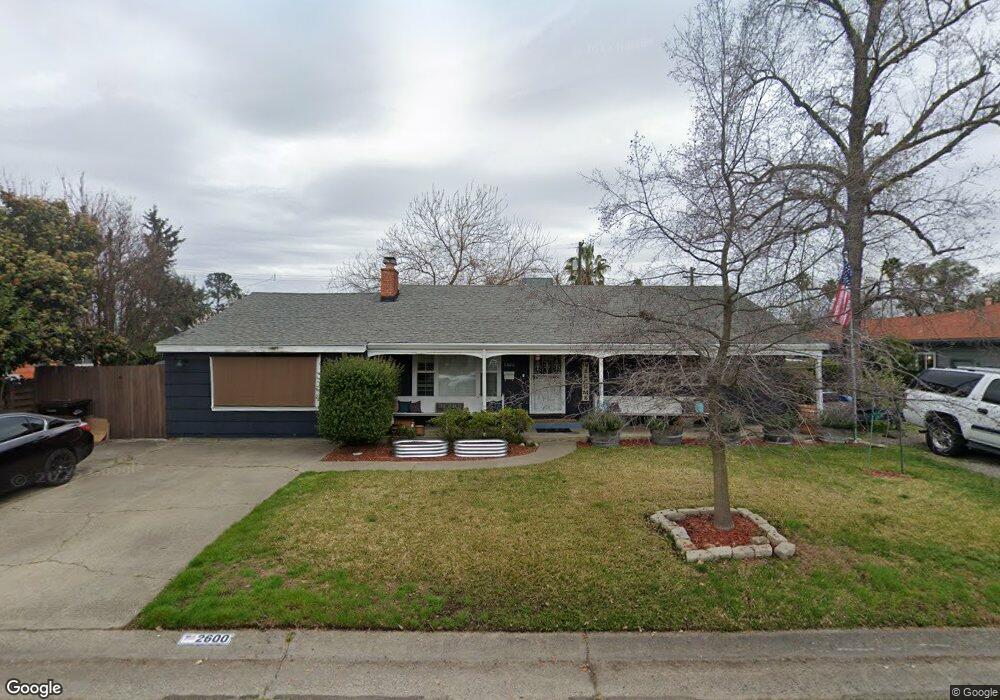
2600 Wright St Sacramento, CA 95821
Bellview NeighborhoodEstimated Value: $324,000 - $427,952
2
Beds
1
Bath
1,151
Sq Ft
$338/Sq Ft
Est. Value
About This Home
This home is located at 2600 Wright St, Sacramento, CA 95821 and is currently estimated at $388,738, approximately $337 per square foot. 2600 Wright St is a home located in Sacramento County with nearby schools including Howe Avenue Elementary School, Encina Preparatory High School, and Aspire Alexander Twilight College Preparatory Academy.
Ownership History
Date
Name
Owned For
Owner Type
Purchase Details
Closed on
Nov 2, 2010
Sold by
Isaacson Eric C Britton and Isaacson Kristin L Britton
Bought by
Isaacson Eric C Britton and Isaacson Kristin L Britton
Current Estimated Value
Home Financials for this Owner
Home Financials are based on the most recent Mortgage that was taken out on this home.
Original Mortgage
$291,577
Outstanding Balance
$192,966
Interest Rate
4.33%
Mortgage Type
VA
Estimated Equity
$195,772
Purchase Details
Closed on
Nov 10, 2006
Sold by
Brown Patrick F and 1994 Louise D Brown Revocable
Bought by
Isaacson Eric C Britton and Isaacson Kristen L Britton
Home Financials for this Owner
Home Financials are based on the most recent Mortgage that was taken out on this home.
Original Mortgage
$290,003
Interest Rate
6.28%
Mortgage Type
VA
Purchase Details
Closed on
Jan 6, 1995
Sold by
Brown Louise D
Bought by
Brown Patrick F and The 1994 Louise D Brown Revoca
Create a Home Valuation Report for This Property
The Home Valuation Report is an in-depth analysis detailing your home's value as well as a comparison with similar homes in the area
Home Values in the Area
Average Home Value in this Area
Purchase History
| Date | Buyer | Sale Price | Title Company |
|---|---|---|---|
| Isaacson Eric C Britton | -- | Orange Coast Title | |
| Isaacson Eric C Britton | $284,000 | Fidelity National Title Co | |
| Brown Patrick F | -- | -- |
Source: Public Records
Mortgage History
| Date | Status | Borrower | Loan Amount |
|---|---|---|---|
| Open | Isaacson Eric C Britton | $291,577 | |
| Closed | Isaacson Eric C Britton | $290,003 |
Source: Public Records
Tax History Compared to Growth
Tax History
| Year | Tax Paid | Tax Assessment Tax Assessment Total Assessment is a certain percentage of the fair market value that is determined by local assessors to be the total taxable value of land and additions on the property. | Land | Improvement |
|---|---|---|---|---|
| 2025 | $4,640 | $395,553 | $301,443 | $94,110 |
| 2024 | $4,640 | $387,798 | $295,533 | $92,265 |
| 2023 | $4,520 | $380,195 | $289,739 | $90,456 |
| 2022 | $4,965 | $372,741 | $284,058 | $88,683 |
| 2021 | $4,026 | $270,597 | $78,923 | $191,674 |
| 2020 | $2,888 | $241,605 | $70,467 | $171,138 |
| 2019 | $2,708 | $226,860 | $66,167 | $160,693 |
| 2018 | $2,569 | $214,020 | $62,422 | $151,598 |
| 2017 | $2,380 | $196,349 | $57,268 | $139,081 |
| 2016 | $2,079 | $180,138 | $52,540 | $127,598 |
| 2015 | $1,865 | $162,288 | $47,334 | $114,954 |
| 2014 | $1,772 | $154,560 | $45,080 | $109,480 |
Source: Public Records
Map
Nearby Homes
- 2416 Wulff Ln
- 2433 Gwen Dr
- 2410 Post Oak Ln
- 2931 Wright St
- 2808 Sweet Way
- 2822 Sweet Way
- 2265 Marconi Ave
- 2133 Cortez Ln
- 2520 Carson Way
- 2620 Darwin St
- 2155 Whippoorwill Ln
- 2550 Carson Way
- 2108 Tevis Rd
- 2727 Lacy Ln
- 2137 Marconi Ave
- 2133 Marconi Ave
- 2513 Anna Way
- 2730 Idlewood Ln
- 2500 Ethan Way
- 2012 El Camino Ave
- 2590 Wright St
- 2600 Park Hills Dr
- 2606 Park Hills Dr
- 2401 Leslie Ln
- 2405 Leslie Ln
- 2409 Leslie Ln
- 2610 Park Hills Dr
- 2611 Wright St
- 2601 Wright St
- 2601 Park Hills Dr
- 2621 Wright St
- 2591 Wright St
- 2413 Leslie Ln
- 2620 Park Hills Dr
- 2607 Park Hills Dr
- 2400 Leslie Ln
- 2631 Wright St
- 2404 Leslie Ln
- 2581 Wright St
- 2417 Leslie Ln