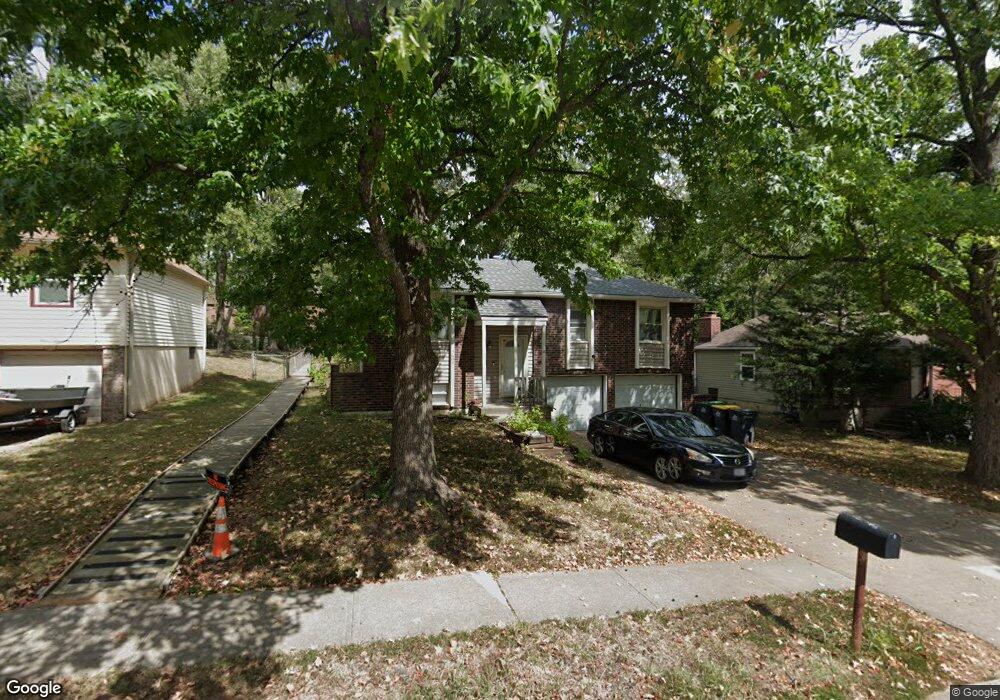
2601 NW Kingsridge Dr Blue Springs, MO 64015
Estimated Value: $228,000 - $256,000
3
Beds
2
Baths
1,120
Sq Ft
$217/Sq Ft
Est. Value
About This Home
This home is located at 2601 NW Kingsridge Dr, Blue Springs, MO 64015 and is currently estimated at $243,236, approximately $217 per square foot. 2601 NW Kingsridge Dr is a home located in Jackson County with nearby schools including James Lewis Elementary School, Brittany Hill Middle School, and Blue Springs High School.
Ownership History
Date
Name
Owned For
Owner Type
Purchase Details
Closed on
Mar 22, 2021
Sold by
Abbott Heather E and Scrivo Heather E
Bought by
Abbott Heather E
Current Estimated Value
Home Financials for this Owner
Home Financials are based on the most recent Mortgage that was taken out on this home.
Original Mortgage
$105,000
Outstanding Balance
$94,597
Interest Rate
3%
Mortgage Type
New Conventional
Estimated Equity
$148,639
Purchase Details
Closed on
Jun 12, 2002
Sold by
Calvin William Preston and Calvin Virginia
Bought by
Scrivo Heather E
Home Financials for this Owner
Home Financials are based on the most recent Mortgage that was taken out on this home.
Original Mortgage
$91,278
Interest Rate
6.77%
Mortgage Type
Purchase Money Mortgage
Purchase Details
Closed on
Oct 13, 2000
Sold by
Calvin Marilyn L
Bought by
Calvin William Preston
Purchase Details
Closed on
Oct 11, 1999
Sold by
Calvin Marilyn L
Bought by
Calvin William Preston
Create a Home Valuation Report for This Property
The Home Valuation Report is an in-depth analysis detailing your home's value as well as a comparison with similar homes in the area
Home Values in the Area
Average Home Value in this Area
Purchase History
| Date | Buyer | Sale Price | Title Company |
|---|---|---|---|
| Abbott Heather E | -- | Vylla Llc | |
| Scrivo Heather E | -- | Stewart Title | |
| Calvin William Preston | -- | -- | |
| Calvin William Preston | -- | -- |
Source: Public Records
Mortgage History
| Date | Status | Borrower | Loan Amount |
|---|---|---|---|
| Open | Abbott Heather E | $105,000 | |
| Closed | Scrivo Heather E | $91,278 |
Source: Public Records
Tax History Compared to Growth
Tax History
| Year | Tax Paid | Tax Assessment Tax Assessment Total Assessment is a certain percentage of the fair market value that is determined by local assessors to be the total taxable value of land and additions on the property. | Land | Improvement |
|---|---|---|---|---|
| 2025 | $3,005 | $32,164 | $6,107 | $26,057 |
| 2024 | $3,005 | $36,833 | $4,081 | $32,752 |
| 2023 | $2,947 | $36,833 | $3,773 | $33,060 |
| 2022 | $2,202 | $24,320 | $3,849 | $20,471 |
| 2021 | $2,200 | $24,320 | $3,849 | $20,471 |
| 2020 | $2,065 | $23,221 | $3,849 | $19,372 |
| 2019 | $1,996 | $23,221 | $3,849 | $19,372 |
| 2018 | $1,805 | $20,210 | $3,350 | $16,860 |
| 2017 | $1,805 | $20,210 | $3,350 | $16,860 |
| 2016 | $1,755 | $19,703 | $2,983 | $16,720 |
| 2014 | $1,699 | $19,006 | $2,780 | $16,226 |
Source: Public Records
Map
Nearby Homes
- 913 NW Camelot Ct
- 2508 NW Castle Dr
- 2804 NW Kingsridge Dr
- 1029 NW Berkshire Dr
- 2317 NW Kensington Ct
- 2916 NW Chelsea Place
- 516 NW Mill Ct
- 3212 NW Canterbury Rd
- 3213 NW Canterbury Place
- 1389 NW Jefferson Ct
- 1618 NW Samantha Ct
- 124 SW 27th St
- 1400 NW Deer Run Trail
- 305 NW 17th St
- 216 SW 26th St
- 503 NW 15th St
- 1604 NW Sunridge Dr
- 3605 NW Dogwood Dr
- 704 NW 39th St
- 2000 SW Smith St
- 2521 NW Kingsridge Dr
- 2605 NW Kingsridge Dr
- 2609 NW Kingsridge Dr
- 2604 NW Pembroke Ct
- 2608 NW Pembroke Ct
- 2604 NW Kingsridge Dr
- 2608 NW Kingsridge Dr
- 2513 NW Kingsridge Dr
- 2613 NW Kingsridge Dr
- 2612 NW Pembroke Ct
- 2520 NW Kingsridge Dr
- 2612 NW Kingsridge Dr
- 2600 NW Pembroke Ct
- 2509 NW Kingsridge Dr
- 2516 NW Kingsridge Dr
- 1016 NW Oxford Dr
- 2616 NW Kingsridge Dr
- 1020 NW Oxford Dr
- 2617 NW Kingsridge Dr
- 2512 NW Kingsridge Dr