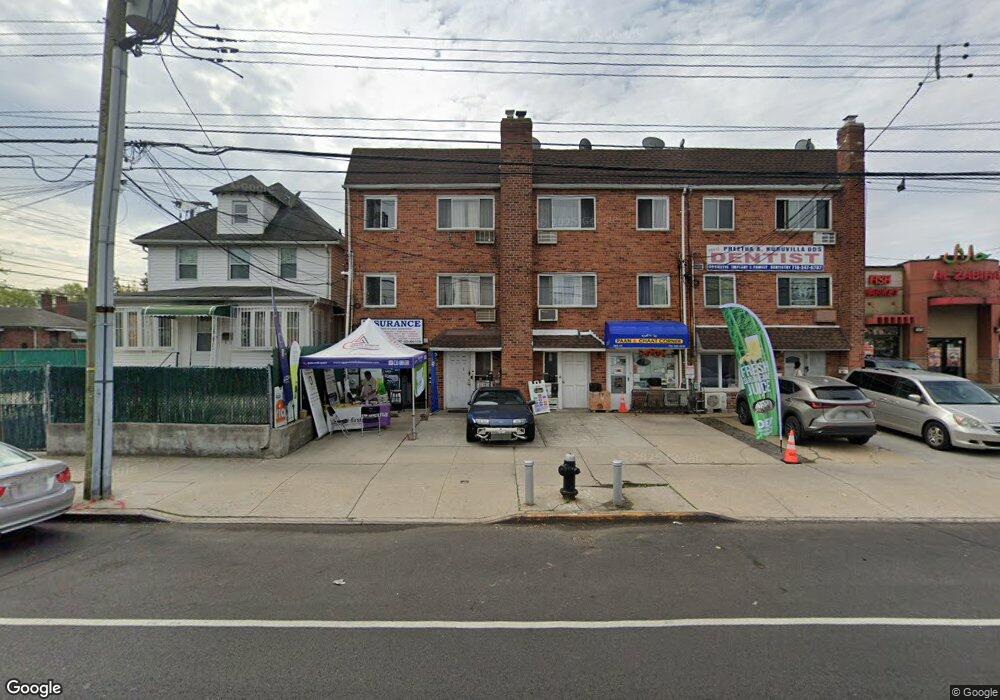
26016 Hillside Ave Glen Oaks, NY 11004
Estimated Value: $1,141,896
--
Bed
--
Bath
2,820
Sq Ft
$405/Sq Ft
Est. Value
About This Home
This home is located at 26016 Hillside Ave, Glen Oaks, NY 11004 and is currently estimated at $1,141,896, approximately $404 per square foot. 26016 Hillside Ave is a home located in Queens County with nearby schools including P.S. 191 Mayflower School, Irwin Altman Middle School 172, and Martin Van Buren High School.
Ownership History
Date
Name
Owned For
Owner Type
Purchase Details
Closed on
Oct 14, 2013
Sold by
Shah Poonam S and Shah Sagar J
Bought by
Usha Realty Llc
Current Estimated Value
Home Financials for this Owner
Home Financials are based on the most recent Mortgage that was taken out on this home.
Original Mortgage
$200,000
Outstanding Balance
$149,364
Interest Rate
4.42%
Mortgage Type
New Conventional
Estimated Equity
$992,532
Purchase Details
Closed on
Sep 10, 2013
Sold by
Drewco Realty Llc
Bought by
Shah Poonam S and Shah Sagar J
Home Financials for this Owner
Home Financials are based on the most recent Mortgage that was taken out on this home.
Original Mortgage
$200,000
Outstanding Balance
$149,364
Interest Rate
4.42%
Mortgage Type
New Conventional
Estimated Equity
$992,532
Purchase Details
Closed on
Oct 11, 2012
Sold by
Paradiso Ronald and Paradiso Rose
Bought by
Drewco Realty Llc
Create a Home Valuation Report for This Property
The Home Valuation Report is an in-depth analysis detailing your home's value as well as a comparison with similar homes in the area
Home Values in the Area
Average Home Value in this Area
Purchase History
| Date | Buyer | Sale Price | Title Company |
|---|---|---|---|
| Usha Realty Llc | -- | -- | |
| Shah Poonam S | $680,000 | -- | |
| Drewco Realty Llc | $615,000 | -- |
Source: Public Records
Mortgage History
| Date | Status | Borrower | Loan Amount |
|---|---|---|---|
| Open | Shah Poonam S | $200,000 |
Source: Public Records
Tax History Compared to Growth
Tax History
| Year | Tax Paid | Tax Assessment Tax Assessment Total Assessment is a certain percentage of the fair market value that is determined by local assessors to be the total taxable value of land and additions on the property. | Land | Improvement |
|---|---|---|---|---|
| 2025 | $10,264 | $54,168 | $14,226 | $39,942 |
| 2024 | $10,264 | $51,102 | $14,852 | $36,250 |
| 2023 | $9,683 | $48,211 | $12,612 | $35,599 |
| 2022 | $9,624 | $63,480 | $20,280 | $43,200 |
| 2021 | $9,855 | $57,720 | $20,280 | $37,440 |
| 2020 | $9,555 | $50,640 | $20,280 | $30,360 |
| 2019 | $8,908 | $44,040 | $20,280 | $23,760 |
| 2018 | $8,190 | $40,176 | $15,735 | $24,441 |
| 2017 | $8,190 | $40,176 | $16,765 | $23,411 |
| 2016 | $7,801 | $40,176 | $16,765 | $23,411 |
| 2015 | $4,707 | $37,617 | $19,702 | $17,915 |
| 2014 | $4,707 | $35,488 | $20,569 | $14,919 |
Source: Public Records
Map
Nearby Homes
- 8343 261st St
- 8418 263rd St
- 8436 259th St
- 261-16 E Williston Ave
- 258-15 83rd Ave
- 85-65 262nd St
- 82-44 263rd St
- 265-08 E Williston Ave
- 85-23 264th St
- 83-14 266th St
- 84-05 266th St
- 84-03 266th St
- 25407 84th Rd
- 8260 266th St
- 293 85th Ave
- 83-29 Little Neck Pkwy
- 119 Emerson Ave
- 81-56 264th St
- 83-36 268th St
- 8133 260th St
- 26016 Hillside Ave Unit 1
- 26016 Hillside Ave
- 26014 Hillside Ave
- 26014 Hillside Ave
- 26022 Hillside Ave
- 84-12 261st St
- 8412 261st St
- 26012 Hillside Ave
- 26012 Hillside Ave Unit Office
- 26012 Hillside Ave
- 26012 Hillside Ave Unit 3
- 26022 Hillside Ave
- 26010 Hillside Ave
- 8416 261st St
- 98 Hillside Ave
- 156 Hillside Ave
- 18 Hillside Ave
- 14 Hillside Ave
- 26004 Hillside Ave
- 84-15 261st St