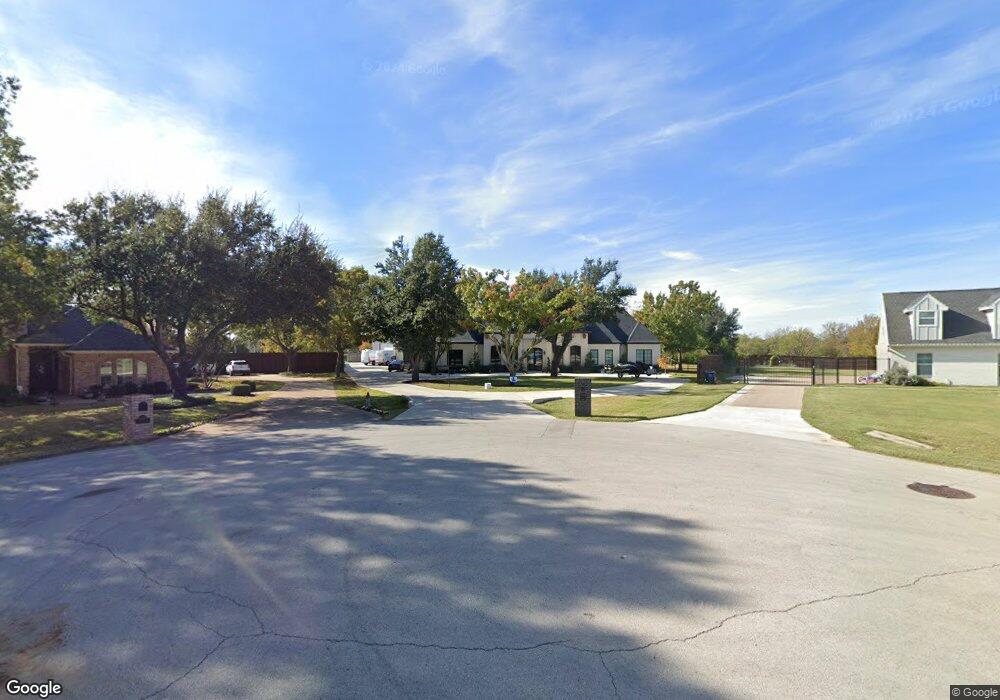
2602 S Quail Run Ct Southlake, TX 76092
Estimated Value: $910,000 - $3,494,000
4
Beds
2
Baths
2,073
Sq Ft
$1,127/Sq Ft
Est. Value
About This Home
This home is located at 2602 S Quail Run Ct, Southlake, TX 76092 and is currently estimated at $2,336,819, approximately $1,127 per square foot. 2602 S Quail Run Ct is a home located in Tarrant County with nearby schools including Jack D. Johnson Elementary, Don T. Durham Intermediate School, and Carroll Middle School.
Ownership History
Date
Name
Owned For
Owner Type
Purchase Details
Closed on
Nov 15, 2013
Sold by
Saeger Julie and Saeger John
Bought by
Hutchinson Mark A and Bellard Hutchinson Ashley
Current Estimated Value
Home Financials for this Owner
Home Financials are based on the most recent Mortgage that was taken out on this home.
Original Mortgage
$244,000
Outstanding Balance
$182,323
Interest Rate
4.28%
Mortgage Type
New Conventional
Estimated Equity
$2,154,496
Purchase Details
Closed on
Aug 6, 2007
Sold by
Braddock Glyn Earl and Braddock Lucy Carolyn
Bought by
Saeger Julie and Saeger John
Home Financials for this Owner
Home Financials are based on the most recent Mortgage that was taken out on this home.
Original Mortgage
$201,731
Interest Rate
6.69%
Mortgage Type
Purchase Money Mortgage
Create a Home Valuation Report for This Property
The Home Valuation Report is an in-depth analysis detailing your home's value as well as a comparison with similar homes in the area
Home Values in the Area
Average Home Value in this Area
Purchase History
| Date | Buyer | Sale Price | Title Company |
|---|---|---|---|
| Hutchinson Mark A | -- | Multiple | |
| Saeger Julie | -- | American Title |
Source: Public Records
Mortgage History
| Date | Status | Borrower | Loan Amount |
|---|---|---|---|
| Open | Hutchinson Mark A | $244,000 | |
| Previous Owner | Saeger Julie | $201,731 |
Source: Public Records
Tax History Compared to Growth
Tax History
| Year | Tax Paid | Tax Assessment Tax Assessment Total Assessment is a certain percentage of the fair market value that is determined by local assessors to be the total taxable value of land and additions on the property. | Land | Improvement |
|---|---|---|---|---|
| 2025 | $18,359 | $3,292,427 | $609,000 | $2,683,427 |
| 2024 | $18,359 | $3,292,427 | $609,000 | $2,683,427 |
| 2023 | $17,716 | $2,942,544 | $609,000 | $2,333,544 |
| 2022 | $21,358 | $1,587,788 | $445,000 | $1,142,788 |
| 2021 | $20,520 | $900,000 | $506,000 | $394,000 |
| 2020 | $21,777 | $947,407 | $506,000 | $441,407 |
| 2019 | $22,971 | $948,614 | $506,000 | $442,614 |
| 2018 | $12,034 | $530,800 | $506,000 | $24,800 |
| 2017 | $11,154 | $450,000 | $306,000 | $144,000 |
| 2016 | $9,667 | $390,000 | $306,500 | $83,500 |
| 2015 | $7,993 | $296,370 | $60,000 | $236,370 |
| 2014 | $7,993 | $319,300 | $60,000 | $259,300 |
Source: Public Records
Map
Nearby Homes
- 1006 Quail Run Rd
- 1018 Quail Run Rd
- 1013 Winfield Ct
- 1099 Burney Ln
- 1340 Burney Ln
- 2920 Burney Ln
- 3300 Jackson Ct
- 1497 E Dove Rd
- 3316 Ferguson Rd
- 3321 Ferguson Rd
- 3325 Ferguson Rd
- 3405 Witt Ct
- 3179 Southlake Park Rd
- 3401 Witt Ct
- 424 Saint Tropez Dr
- 3501 N Gravel Cir
- 2112 Beaver Creek Ln
- 136 Sweet St
- 3333 Southlake Park Rd
- 5 W Dove Rd
- 2604 S Quail Run Ct
- 2521 Oakbend Ct
- 2600 S Quail Run Ct
- 2517 Oakbend Ct
- 1003 Quail Run Rd
- 2601 S Quail Run Ct
- 2513 Oak Bend Ct
- 1001 Quail Run Rd
- 1005 Quail Run Rd
- 2603 S Quail Run Ct
- 1007 Quail Run Rd
- 2509 Oakbend Ct
- 2605 S Quail Run Ct
- 808 Victoria Ln
- 807 Victoria Ln
- 2505 Oakbend Ct
- 2505 Oak Bend Ct
- 1013 Quail Run Rd
- 1105 Quail Run Rd
- 1002 Quail Run Rd