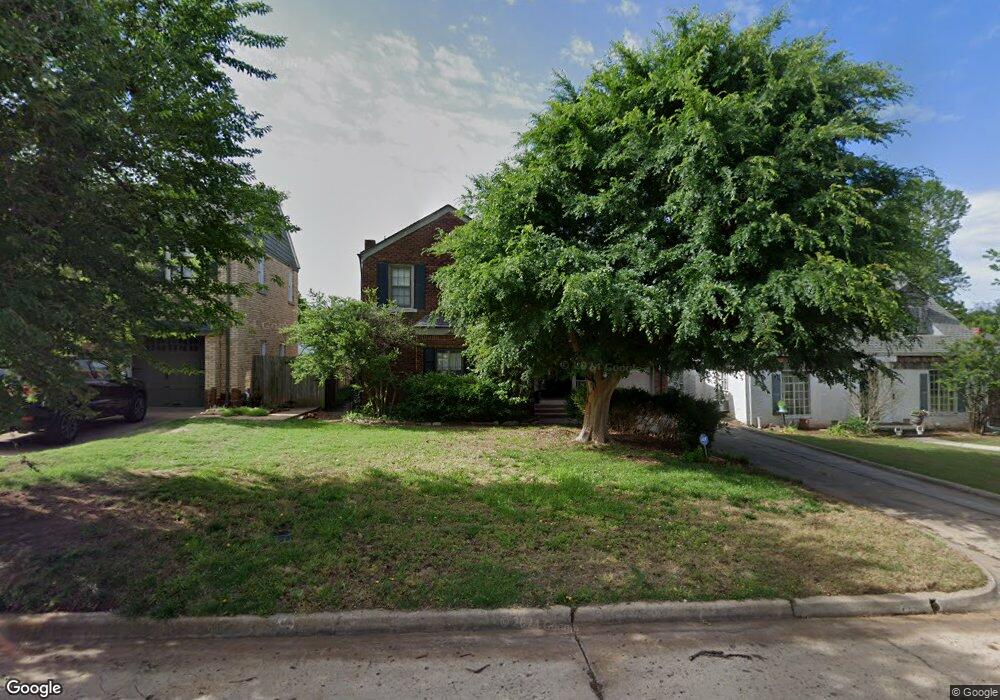
2604 NW 29th St Oklahoma City, OK 73107
Cleveland UCD NeighborhoodEstimated Value: $263,000 - $287,000
3
Beds
2
Baths
1,682
Sq Ft
$163/Sq Ft
Est. Value
About This Home
This home is located at 2604 NW 29th St, Oklahoma City, OK 73107 and is currently estimated at $274,127, approximately $162 per square foot. 2604 NW 29th St is a home located in Oklahoma County with nearby schools including Cleveland Elementary School, Taft Middle School, and Northwest Classen High School.
Ownership History
Date
Name
Owned For
Owner Type
Purchase Details
Closed on
Jun 16, 2010
Sold by
Maciver Pamela A
Bought by
Stevener Kyle David
Current Estimated Value
Home Financials for this Owner
Home Financials are based on the most recent Mortgage that was taken out on this home.
Original Mortgage
$132,400
Outstanding Balance
$88,560
Interest Rate
4.93%
Mortgage Type
Purchase Money Mortgage
Estimated Equity
$185,567
Purchase Details
Closed on
Jun 8, 2005
Sold by
Dierker Jennifer R and Dierker Lance
Bought by
Maciver Pamela A
Home Financials for this Owner
Home Financials are based on the most recent Mortgage that was taken out on this home.
Original Mortgage
$121,125
Interest Rate
5.78%
Mortgage Type
Fannie Mae Freddie Mac
Purchase Details
Closed on
Sep 5, 1997
Sold by
Williams Andrew James and Williams Janice Kay
Bought by
Dierker Jennifer R and Dierker Lance
Create a Home Valuation Report for This Property
The Home Valuation Report is an in-depth analysis detailing your home's value as well as a comparison with similar homes in the area
Home Values in the Area
Average Home Value in this Area
Purchase History
| Date | Buyer | Sale Price | Title Company |
|---|---|---|---|
| Stevener Kyle David | $172,000 | Old Republic Title Co Of Ok | |
| Maciver Pamela A | $127,500 | Heartland Title & Closing | |
| Dierker Jennifer R | $82,000 | -- |
Source: Public Records
Mortgage History
| Date | Status | Borrower | Loan Amount |
|---|---|---|---|
| Open | Stevener Kyle David | $132,400 | |
| Previous Owner | Maciver Pamela A | $121,125 |
Source: Public Records
Tax History Compared to Growth
Tax History
| Year | Tax Paid | Tax Assessment Tax Assessment Total Assessment is a certain percentage of the fair market value that is determined by local assessors to be the total taxable value of land and additions on the property. | Land | Improvement |
|---|---|---|---|---|
| 2024 | $2,822 | $24,692 | $4,124 | $20,568 |
| 2023 | $2,822 | $23,973 | $4,080 | $19,893 |
| 2022 | $2,620 | $23,274 | $4,652 | $18,622 |
| 2021 | $2,542 | $22,597 | $4,852 | $17,745 |
| 2020 | $2,493 | $21,939 | $3,649 | $18,290 |
| 2019 | $2,416 | $21,300 | $3,517 | $17,783 |
| 2018 | $2,233 | $20,680 | $0 | $0 |
| 2017 | $2,181 | $20,239 | $3,823 | $16,416 |
| 2016 | $2,120 | $19,690 | $3,267 | $16,423 |
| 2015 | $2,094 | $19,292 | $3,267 | $16,025 |
| 2014 | $2,022 | $18,764 | $3,267 | $15,497 |
Source: Public Records
Map
Nearby Homes
- 3004 N Venice Blvd
- 2508 Cummings Dr
- 2640 NW 27th St
- 2648 NW 27th St
- 2532 NW 26th St
- 2533 NW 25th St
- 2600 Cashion Place
- 2536 NW 25th St
- 2720 NW 26th St
- 2647 NW 24th St
- 2329 NW 28th St
- 2617 NW 23rd St
- 2537 NW 31st St
- 2737 Cashion Place
- 2560 NW 23rd St
- 2705 NW 31st St
- 2341 Cashion Place
- 2621 NW 32nd St
- 2517 NW 22nd St
- 2509 NW 22nd St
- 2608 NW 29th St
- 2600 NW 29th St
- 2916 N Venice Blvd
- 2544 NW 29th St
- 2900 N Venice Blvd
- 2601 NW 28th St
- 2545 NW 28th St
- 2540 NW 29th St
- 2605 NW 29th St
- 2609 NW 29th St
- 2601 NW 29th St
- 2613 NW 29th St
- 2541 NW 28th St
- 2545 NW 29th St
- 2536 NW 29th St
- 2617 NW 29th St
- 2617 NW 28th St
- 2541 NW 29th St
- 2537 NW 28th St
- 2532 NW 29th St