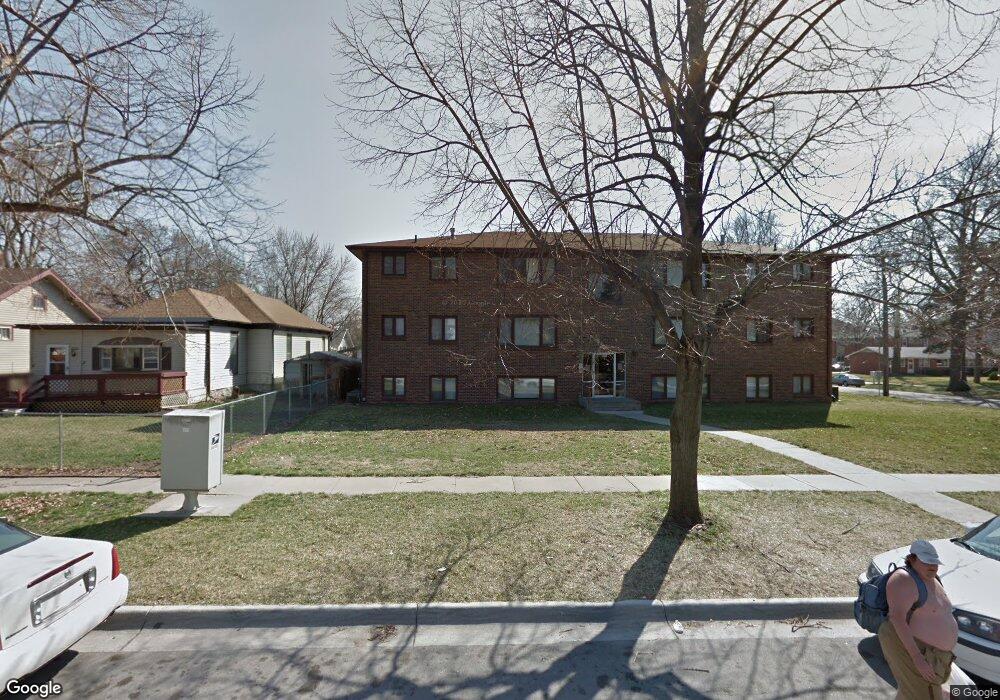
2605 K St Lincoln, NE 68510
Woods Park NeighborhoodEstimated Value: $785,522
--
Bed
7
Baths
4,881
Sq Ft
$161/Sq Ft
Est. Value
About This Home
This home is located at 2605 K St, Lincoln, NE 68510 and is currently estimated at $785,522, approximately $160 per square foot. 2605 K St is a home located in Lancaster County with nearby schools including Elliott Elementary School, Lefler Middle School, and Lincoln High School.
Ownership History
Date
Name
Owned For
Owner Type
Purchase Details
Closed on
Mar 20, 2013
Sold by
Flodman Hunter R and Flodman Nichole J
Bought by
Hn Investments Llc
Current Estimated Value
Purchase Details
Closed on
May 28, 2010
Sold by
Florell Robert J and Florell Idonna J
Bought by
Flodman Hunter and Flodman Nichole
Home Financials for this Owner
Home Financials are based on the most recent Mortgage that was taken out on this home.
Original Mortgage
$130,000
Interest Rate
5%
Mortgage Type
Future Advance Clause Open End Mortgage
Purchase Details
Closed on
Nov 15, 2007
Sold by
Florell Family Partnership
Bought by
Florell Robert J and Florell Idonna J
Create a Home Valuation Report for This Property
The Home Valuation Report is an in-depth analysis detailing your home's value as well as a comparison with similar homes in the area
Home Values in the Area
Average Home Value in this Area
Purchase History
| Date | Buyer | Sale Price | Title Company |
|---|---|---|---|
| Hn Investments Llc | -- | None Available | |
| Flodman Hunter | $355,000 | Multiple | |
| Florell Robert J | -- | None Available |
Source: Public Records
Mortgage History
| Date | Status | Borrower | Loan Amount |
|---|---|---|---|
| Previous Owner | Flodman Hunter | $130,000 |
Source: Public Records
Tax History Compared to Growth
Tax History
| Year | Tax Paid | Tax Assessment Tax Assessment Total Assessment is a certain percentage of the fair market value that is determined by local assessors to be the total taxable value of land and additions on the property. | Land | Improvement |
|---|---|---|---|---|
| 2025 | $8,335 | $640,700 | $71,500 | $569,200 |
| 2024 | $8,335 | $610,200 | $71,500 | $538,700 |
| 2023 | $10,847 | $647,200 | $71,500 | $575,700 |
| 2022 | $11,346 | $569,300 | $71,500 | $497,800 |
| 2021 | $9,471 | $502,300 | $71,500 | $430,800 |
| 2020 | $7,108 | $372,000 | $71,500 | $300,500 |
| 2019 | $7,109 | $372,000 | $71,500 | $300,500 |
| 2018 | $7,140 | $372,000 | $71,500 | $300,500 |
| 2017 | $6,732 | $347,500 | $71,500 | $276,000 |
| 2016 | $6,766 | $347,500 | $71,500 | $276,000 |
| 2015 | $6,720 | $347,500 | $71,500 | $276,000 |
| 2014 | $6,226 | $320,100 | $71,500 | $248,600 |
| 2013 | -- | $320,100 | $71,500 | $248,600 |
Source: Public Records
Map
Nearby Homes