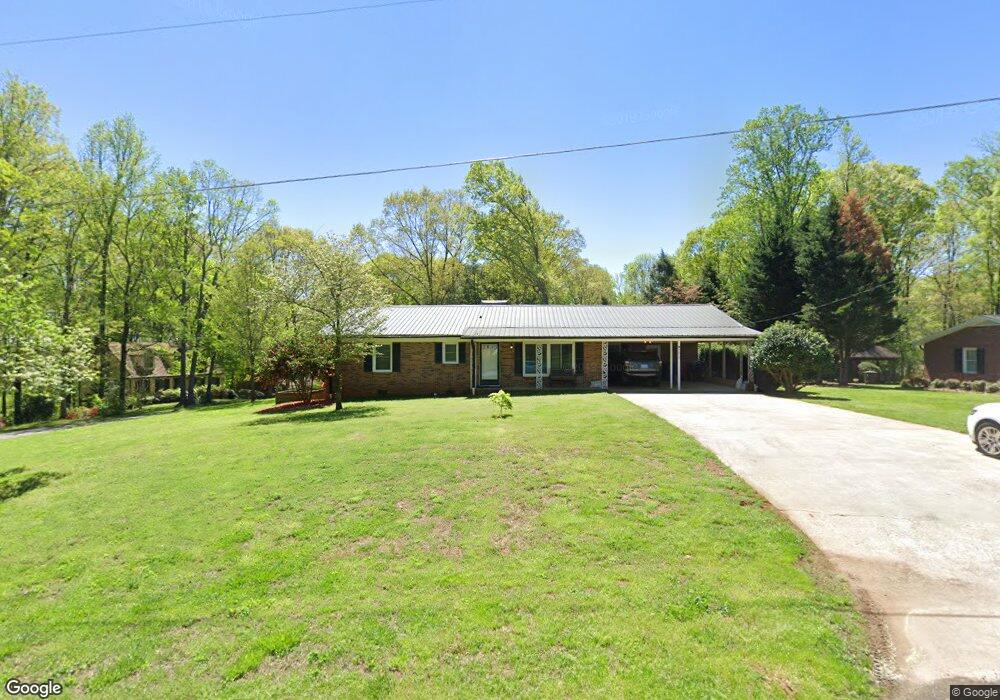
2610 Montgomery Dr Statesville, NC 28625
Estimated Value: $315,432 - $344,000
3
Beds
2
Baths
2,022
Sq Ft
$163/Sq Ft
Est. Value
About This Home
This home is located at 2610 Montgomery Dr, Statesville, NC 28625 and is currently estimated at $329,108, approximately $162 per square foot. 2610 Montgomery Dr is a home located in Iredell County with nearby schools including East Iredell Elementary School, East Iredell Middle School, and Statesville High School.
Ownership History
Date
Name
Owned For
Owner Type
Purchase Details
Closed on
Aug 4, 2015
Sold by
Paz Sara Leigh and Oliva Josue Paz
Bought by
Haliburton William Iden and Anthony Frances Elaine
Current Estimated Value
Home Financials for this Owner
Home Financials are based on the most recent Mortgage that was taken out on this home.
Original Mortgage
$130,500
Outstanding Balance
$102,672
Interest Rate
4.04%
Mortgage Type
New Conventional
Estimated Equity
$226,436
Purchase Details
Closed on
Oct 24, 2005
Sold by
Padgett Marie W and King Peggy Padgett
Bought by
Oliva Josue Paz and Paz Sara Leigh
Home Financials for this Owner
Home Financials are based on the most recent Mortgage that was taken out on this home.
Original Mortgage
$122,000
Interest Rate
5.66%
Mortgage Type
Fannie Mae Freddie Mac
Purchase Details
Closed on
Jun 1, 1967
Create a Home Valuation Report for This Property
The Home Valuation Report is an in-depth analysis detailing your home's value as well as a comparison with similar homes in the area
Home Values in the Area
Average Home Value in this Area
Purchase History
| Date | Buyer | Sale Price | Title Company |
|---|---|---|---|
| Haliburton William Iden | $145,000 | Attorney | |
| Oliva Josue Paz | $132,000 | -- | |
| -- | -- | -- |
Source: Public Records
Mortgage History
| Date | Status | Borrower | Loan Amount |
|---|---|---|---|
| Open | Haliburton William Iden | $130,500 | |
| Previous Owner | Oliva Josue Paz | $122,000 |
Source: Public Records
Tax History Compared to Growth
Tax History
| Year | Tax Paid | Tax Assessment Tax Assessment Total Assessment is a certain percentage of the fair market value that is determined by local assessors to be the total taxable value of land and additions on the property. | Land | Improvement |
|---|---|---|---|---|
| 2024 | $2,193 | $209,620 | $35,000 | $174,620 |
| 2023 | $2,193 | $209,620 | $35,000 | $174,620 |
| 2022 | $1,579 | $134,450 | $20,000 | $114,450 |
| 2021 | $1,635 | $134,450 | $20,000 | $114,450 |
| 2020 | $1,635 | $134,450 | $20,000 | $114,450 |
| 2019 | $1,622 | $134,450 | $20,000 | $114,450 |
| 2018 | $1,521 | $133,700 | $24,000 | $109,700 |
| 2017 | $1,492 | $133,700 | $24,000 | $109,700 |
| 2016 | $1,492 | $133,700 | $24,000 | $109,700 |
| 2015 | $1,305 | $133,700 | $24,000 | $109,700 |
| 2014 | $1,297 | $139,050 | $24,000 | $115,050 |
Source: Public Records
Map
Nearby Homes
- 428 Florence Cir
- 383 Hollingswood Dr
- 206 White Apple Way
- 3027 Findley Rd
- 517 Augusta Dr
- 608 Sharon Dr
- 604 Sharon Dr
- 414 S Toria Dr
- 220 Augusta Dr
- 144 Dyssa Loop
- 126 Dyssa Loop
- 2104 Farmbrook Dr
- 2231 Ballingarry Dr
- 104 Trissy Ct
- 2422 Abernathy Ave
- 2422 Abernathy Ave Unit 55
- 324 Gaston Ct
- 234 Edgewood Dr
- 2680 Andes Dr
- 415 N Greenbriar Rd
- 2606 Montgomery Dr
- 421 Florence Cir
- 434 Florence Cir
- Lot#59 Florence Cir Unit 59
- 2611 Montgomery Dr
- 2607 Montgomery Dr
- 438 Florence Cir
- 401 Florence Cir
- 419 Florence Cir
- 2605 Montgomery Dr
- 432 Florence Cir
- 307 Florence Rd
- 2610 Caroline St
- 312 Montgomery Dr
- 2606 Caroline St
- 403 Florence Cir
- 430 Florence Cir
- 2603 Montgomery Dr
- 2603 Montgomery Dr Unit 25
- 418 Florence Cir