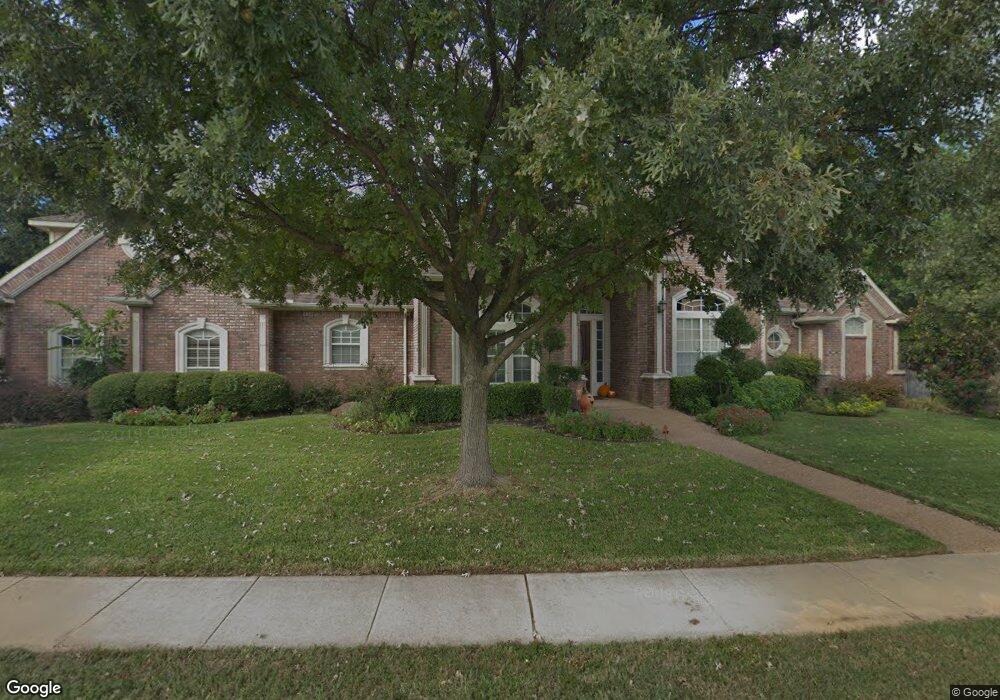
2610 Parker Ct Southlake, TX 76092
Estimated Value: $1,030,000 - $1,237,005
4
Beds
4
Baths
3,945
Sq Ft
$290/Sq Ft
Est. Value
About This Home
This home is located at 2610 Parker Ct, Southlake, TX 76092 and is currently estimated at $1,143,501, approximately $289 per square foot. 2610 Parker Ct is a home located in Tarrant County with nearby schools including Jack D. Johnson Elementary, Don T. Durham Intermediate School, and Carroll Middle School.
Ownership History
Date
Name
Owned For
Owner Type
Purchase Details
Closed on
Jun 27, 2013
Sold by
Scott Robert Stephenson and Scott Alta Gay
Bought by
Dunn Diane G and Dunn Jeffrey K
Current Estimated Value
Home Financials for this Owner
Home Financials are based on the most recent Mortgage that was taken out on this home.
Original Mortgage
$49,850
Outstanding Balance
$11,544
Interest Rate
3.54%
Mortgage Type
Stand Alone Second
Estimated Equity
$1,131,957
Purchase Details
Closed on
Jun 12, 1996
Sold by
Kresler Homes Inc
Bought by
Scott Robert Stephenson and Scott Alta Gay
Home Financials for this Owner
Home Financials are based on the most recent Mortgage that was taken out on this home.
Original Mortgage
$275,500
Interest Rate
7.62%
Create a Home Valuation Report for This Property
The Home Valuation Report is an in-depth analysis detailing your home's value as well as a comparison with similar homes in the area
Home Values in the Area
Average Home Value in this Area
Purchase History
| Date | Buyer | Sale Price | Title Company |
|---|---|---|---|
| Dunn Diane G | -- | None Available | |
| Scott Robert Stephenson | -- | American Title Company |
Source: Public Records
Mortgage History
| Date | Status | Borrower | Loan Amount |
|---|---|---|---|
| Open | Dunn Diane G | $49,850 | |
| Previous Owner | Scott Robert Stephenson | $275,500 |
Source: Public Records
Tax History Compared to Growth
Tax History
| Year | Tax Paid | Tax Assessment Tax Assessment Total Assessment is a certain percentage of the fair market value that is determined by local assessors to be the total taxable value of land and additions on the property. | Land | Improvement |
|---|---|---|---|---|
| 2025 | $14,301 | $898,000 | $322,800 | $575,200 |
| 2024 | $14,301 | $949,829 | $322,800 | $627,029 |
| 2023 | $15,681 | $974,063 | $322,800 | $651,263 |
| 2022 | $16,873 | $829,942 | $215,200 | $614,742 |
| 2021 | $16,211 | $711,000 | $215,200 | $495,800 |
| 2020 | $15,860 | $690,000 | $193,680 | $496,320 |
| 2019 | $15,964 | $659,250 | $110,000 | $549,250 |
| 2018 | $14,329 | $629,200 | $110,000 | $519,200 |
| 2017 | $14,178 | $572,000 | $100,000 | $472,000 |
| 2016 | $13,502 | $578,030 | $100,000 | $478,030 |
| 2015 | $11,958 | $495,200 | $45,000 | $450,200 |
| 2014 | $11,958 | $495,200 | $45,000 | $450,200 |
Source: Public Records
Map
Nearby Homes
- 1099 Burney Ln
- 1340 Burney Ln
- 1006 Quail Run Rd
- 3321 Ferguson Rd
- 3316 Ferguson Rd
- 3325 Ferguson Rd
- 3300 Jackson Ct
- 3405 Witt Ct
- 3401 Witt Ct
- 1013 Winfield Ct
- 3501 N Gravel Cir
- 1497 E Dove Rd
- 1018 Quail Run Rd
- 2920 Burney Ln
- 3055 Midway Rd
- 1920 Fox Hollow Cir
- 3179 Southlake Park Rd
- 424 Saint Tropez Dr
- 3333 Southlake Park Rd
- 1621 Carruth Ln
- 2608 Parker Ct
- 2602 Medlin Ct
- 2612 Parker Ct
- 2606 Parker Ct
- 2606 Medlin Ct
- 2604 Medlin Ct
- 2603 Parker Ct
- 1207 Hat Creek Trail
- 2600 Milk River Crossing
- 2604 Parker Ct
- 2602 Milk River Crossing
- 1209 Hat Creek Trail
- 2604 Milk River Crossing
- 1205 Hat Creek Trail
- 2600 Parker Ct
- 2602 Parker Ct
- 1203 Hat Creek Trail
- 1211 Hat Creek Trail
- 2601 Parker Ct
- 1201 Hat Creek Trail