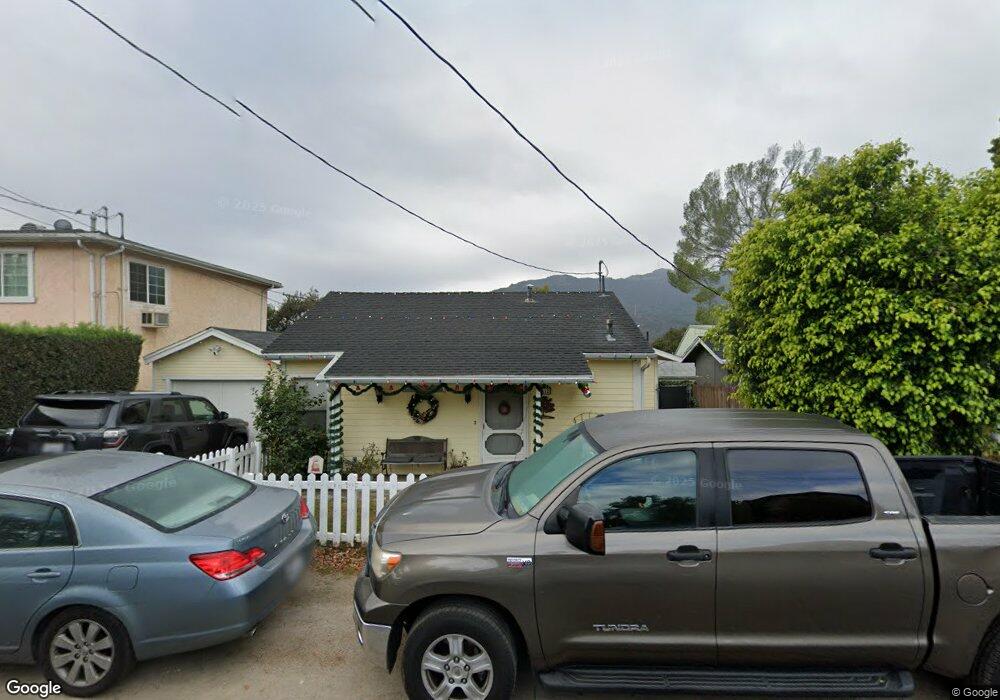
2612 Manhattan Ave Montrose, CA 91020
Sparr Heights NeighborhoodEstimated Value: $816,430 - $1,051,000
2
Beds
2
Baths
989
Sq Ft
$952/Sq Ft
Est. Value
About This Home
This home is located at 2612 Manhattan Ave, Montrose, CA 91020 and is currently estimated at $941,858, approximately $952 per square foot. 2612 Manhattan Ave is a home located in Los Angeles County with nearby schools including La Crescenta Elementary School, Rosemont Middle School, and Crescenta Valley High School.
Ownership History
Date
Name
Owned For
Owner Type
Purchase Details
Closed on
Aug 20, 2002
Sold by
Halowell Thomas L
Bought by
Halowell Thomas L and Halowell Theresa J
Current Estimated Value
Home Financials for this Owner
Home Financials are based on the most recent Mortgage that was taken out on this home.
Original Mortgage
$55,500
Interest Rate
6.29%
Mortgage Type
Credit Line Revolving
Purchase Details
Closed on
Mar 16, 2000
Sold by
Lapham John J
Bought by
Halowell Thomas I and Halowell Theresa J
Home Financials for this Owner
Home Financials are based on the most recent Mortgage that was taken out on this home.
Original Mortgage
$190,000
Outstanding Balance
$64,161
Interest Rate
8.24%
Mortgage Type
FHA
Estimated Equity
$877,697
Purchase Details
Closed on
Feb 17, 1994
Sold by
Lapham Claudia Patricia
Bought by
Lapham John Joseph and Lapham Claudia Patricia
Home Financials for this Owner
Home Financials are based on the most recent Mortgage that was taken out on this home.
Original Mortgage
$126,000
Interest Rate
7.09%
Create a Home Valuation Report for This Property
The Home Valuation Report is an in-depth analysis detailing your home's value as well as a comparison with similar homes in the area
Home Values in the Area
Average Home Value in this Area
Purchase History
| Date | Buyer | Sale Price | Title Company |
|---|---|---|---|
| Halowell Thomas L | -- | Fidelity National Title Co | |
| Halowell Thomas I | $193,000 | Southland Title Corporation | |
| Lapham John Joseph | -- | Old Republic Title Company |
Source: Public Records
Mortgage History
| Date | Status | Borrower | Loan Amount |
|---|---|---|---|
| Closed | Halowell Thomas L | $55,500 | |
| Open | Halowell Thomas I | $190,000 | |
| Previous Owner | Lapham John Joseph | $126,000 |
Source: Public Records
Tax History Compared to Growth
Tax History
| Year | Tax Paid | Tax Assessment Tax Assessment Total Assessment is a certain percentage of the fair market value that is determined by local assessors to be the total taxable value of land and additions on the property. | Land | Improvement |
|---|---|---|---|---|
| 2025 | $3,506 | $296,612 | $237,298 | $59,314 |
| 2024 | $3,506 | $290,797 | $232,646 | $58,151 |
| 2023 | $3,432 | $285,096 | $228,085 | $57,011 |
| 2022 | $3,180 | $279,507 | $223,613 | $55,894 |
| 2021 | $3,123 | $274,028 | $219,229 | $54,799 |
| 2019 | $3,004 | $265,903 | $212,728 | $53,175 |
| 2018 | $2,934 | $260,690 | $208,557 | $52,133 |
| 2016 | $2,794 | $250,568 | $200,459 | $50,109 |
| 2015 | $2,738 | $246,805 | $197,448 | $49,357 |
| 2014 | $2,720 | $241,972 | $193,581 | $48,391 |
Source: Public Records
Map
Nearby Homes
- 2522 Fairway Ave
- 2710 Piedmont Ave Unit 21
- 2468 Montrose Ave Unit 6
- 3928 La Crescenta Ave
- 2754 Montrose Ave
- 2806 Manhattan Ave
- 2743 Montrose Ave Unit 110
- 4328 Sunset Ave
- 2434 Prospect Ave
- 4326 Briggs Ave
- 4133 La Crescenta Ave
- 2817 Montrose Ave
- 3658 Sierra Vista Ave
- 2700 Prospect Ave
- 2966 Piedmont Ave
- 2249 Montrose Ave Unit 7
- 2619 Mary St
- 2222 Montrose Ave Unit G
- 3010 Montrose Ave Unit 33
- 3010 Montrose Ave Unit 3
- 2616 Manhattan Ave
- 2617 Piedmont Ave
- 2621 Piedmont Ave
- 2608 Piedmont Ave
- 2625 Piedmont Ave
- 2608 Manhattan Ave Unit B
- 2629 Piedmont Ave
- 2613 Piedmont Ave
- 2611 Manhattan Ave
- 4025 Rosemont Ave
- 2607 Manhattan Ave
- 2622 Manhattan Ave
- 2600 Manhattan Ave
- 2615 Manhattan Ave Unit A
- 2615 Manhattan Ave
- 2633 Piedmont Ave
- 2604 Piedmont Ave
- 2602 Piedmont Ave
- 2619 Manhattan Ave
- 2600 Pickens Ave