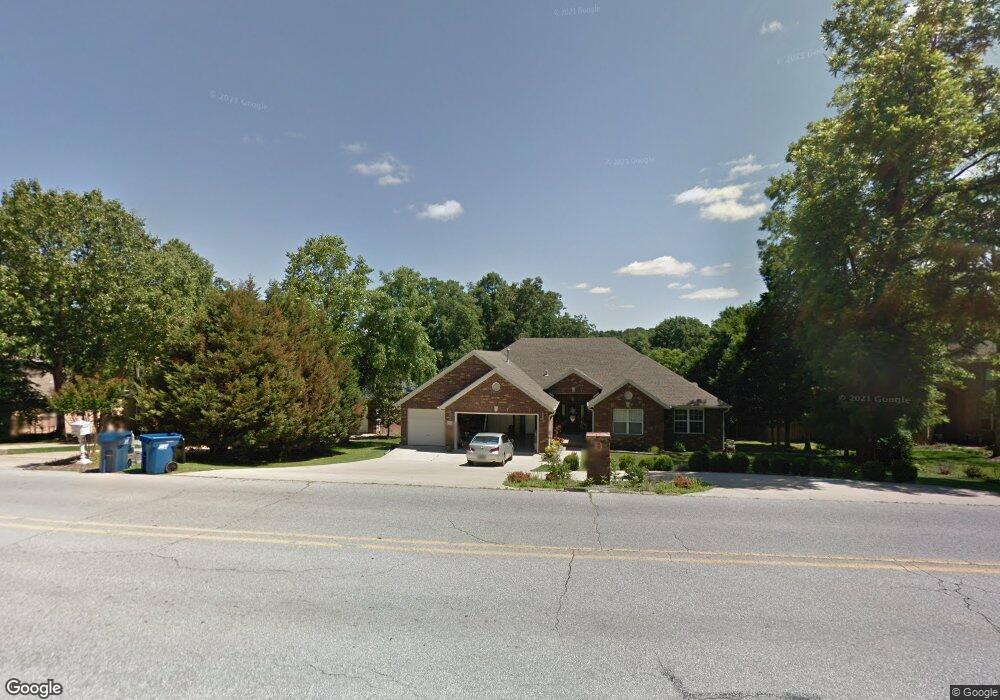
2612 NW A St Bentonville, AR 72712
Estimated Value: $710,000 - $775,000
4
Beds
3
Baths
2,932
Sq Ft
$250/Sq Ft
Est. Value
About This Home
This home is located at 2612 NW A St, Bentonville, AR 72712 and is currently estimated at $733,107, approximately $250 per square foot. 2612 NW A St is a home located in Benton County with nearby schools including Sugar Creek Elementary School, Lincoln Junior High School, and Old High Middle School.
Ownership History
Date
Name
Owned For
Owner Type
Purchase Details
Closed on
Mar 20, 2009
Sold by
Blackaby Kurt and Blackaby April
Bought by
Gucker Donald K and Gucker Judith P
Current Estimated Value
Home Financials for this Owner
Home Financials are based on the most recent Mortgage that was taken out on this home.
Original Mortgage
$140,500
Outstanding Balance
$89,386
Interest Rate
5.14%
Mortgage Type
Purchase Money Mortgage
Estimated Equity
$643,721
Purchase Details
Closed on
Nov 9, 2005
Sold by
J & J Dollar Llc
Bought by
Blackaby Kurt and Blackaby April
Purchase Details
Closed on
Aug 7, 2005
Sold by
Deep Stream Llc
Bought by
J & J Dollar Llc
Purchase Details
Closed on
Dec 5, 2003
Bought by
Deep 4P
Purchase Details
Closed on
Jun 13, 1994
Bought by
Hidden Spr Ent
Purchase Details
Closed on
Jun 9, 1994
Bought by
Hidden Springs Enterprises, In
Purchase Details
Closed on
May 22, 1990
Bought by
Saba and Saba Elqura
Create a Home Valuation Report for This Property
The Home Valuation Report is an in-depth analysis detailing your home's value as well as a comparison with similar homes in the area
Home Values in the Area
Average Home Value in this Area
Purchase History
| Date | Buyer | Sale Price | Title Company |
|---|---|---|---|
| Gucker Donald K | $236,000 | None Available | |
| Blackaby Kurt | $30,000 | Waco Title Company | |
| J & J Dollar Llc | -- | None Available | |
| Deep 4P | $162,000 | -- | |
| Hidden Spr Ent | -- | -- | |
| Hidden Springs Enterprises, In | -- | -- | |
| Saba | -- | -- |
Source: Public Records
Mortgage History
| Date | Status | Borrower | Loan Amount |
|---|---|---|---|
| Open | Gucker Donald K | $140,500 |
Source: Public Records
Tax History Compared to Growth
Tax History
| Year | Tax Paid | Tax Assessment Tax Assessment Total Assessment is a certain percentage of the fair market value that is determined by local assessors to be the total taxable value of land and additions on the property. | Land | Improvement |
|---|---|---|---|---|
| 2025 | $3,569 | $122,008 | $30,000 | $92,008 |
| 2024 | $3,586 | $122,008 | $30,000 | $92,008 |
| 2023 | $3,586 | $78,640 | $8,600 | $70,040 |
| 2022 | $3,292 | $78,640 | $8,600 | $70,040 |
| 2021 | $3,285 | $78,640 | $8,600 | $70,040 |
| 2020 | $3,321 | $65,500 | $7,400 | $58,100 |
| 2019 | $3,321 | $65,500 | $7,400 | $58,100 |
| 2018 | $3,346 | $65,500 | $7,400 | $58,100 |
| 2017 | $3,230 | $65,500 | $7,400 | $58,100 |
| 2016 | $3,230 | $65,500 | $7,400 | $58,100 |
| 2015 | $3,463 | $56,030 | $8,000 | $48,030 |
| 2014 | $3,113 | $56,030 | $8,000 | $48,030 |
Source: Public Records
Map
Nearby Homes
- 14 Valley View Cir
- 0 NW Turner Dr
- 2311 NW Harvard Walk
- 2017 NW Desoto Dr
- 12502 Slaughter Pen Rd
- 9 Hanna Dr
- Lot 3 NW Hidden Cove
- 203 NW Lasalle Dr
- 802 NW 20th St
- 3419 NW Riverbend Rd
- 1703 Kimberly Place
- 1 Greenridge Ln
- 703 NE Heights Ln
- 701 NE Heights Ln
- 833 NE Heights Ln
- 837 NE Heights Ln
- 1606 Kimberly Place
- 1605 Kimberly Place
- 836 NE Heights Ln
- 1016 NW A St
- 2614 NW A St
- 2610 NW A St
- 2616 NW A St
- 2602 NW A St
- 2611 NW Turner Dr
- 2611 NW Turner Dr
- 2512 NW Turner Dr
- 2615 NW A St
- 2617 NW A St
- 2515 NW Turner Dr
- 2510 NW Turner Dr
- 2704 NW A St
- 2511 NW Turner Dr
- 2701 NW A St
- 2703 NW A St
- 2507 NW Turner Dr
- 2508 NW Turner Dr
- 2505 NW Turner Dr
- 2414 Rita Way
- 2506 NW Turner Dr