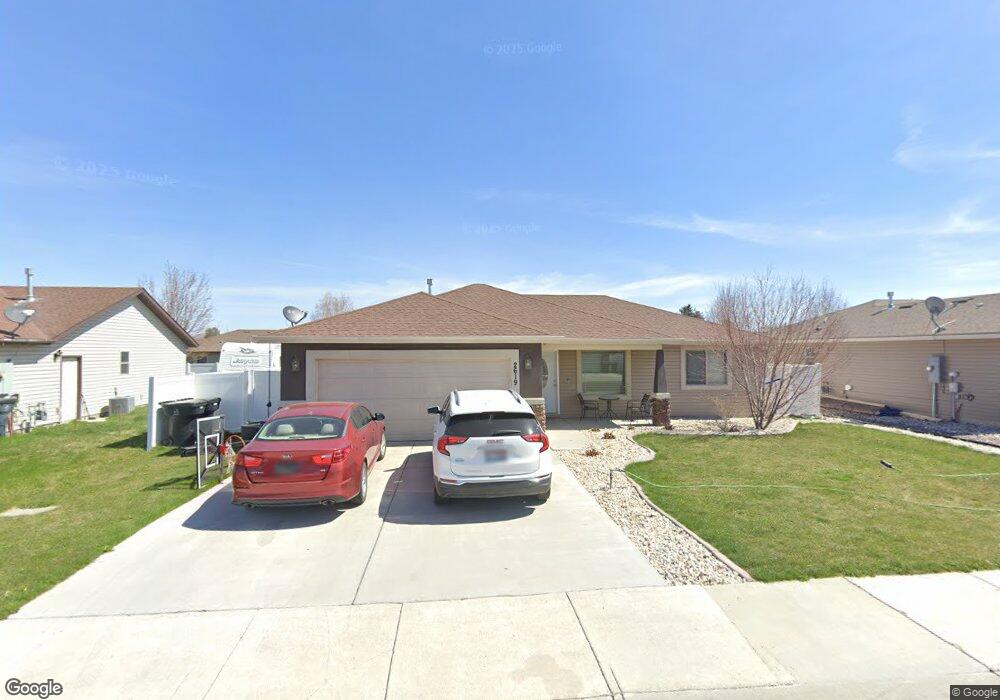
2619 Yellowstone Trail Burley, ID 83318
Estimated Value: $317,000 - $345,000
3
Beds
2
Baths
1,564
Sq Ft
$211/Sq Ft
Est. Value
About This Home
This home is located at 2619 Yellowstone Trail, Burley, ID 83318 and is currently estimated at $329,322, approximately $210 per square foot. 2619 Yellowstone Trail is a home located in Cassia County with nearby schools including Mountain View Elementary School, White Pine Elementary School, and Burley Junior High School.
Ownership History
Date
Name
Owned For
Owner Type
Purchase Details
Closed on
Nov 18, 2021
Sold by
Castaneda Jennie P and Perez Jennie
Bought by
Castaneda Jennie P
Current Estimated Value
Home Financials for this Owner
Home Financials are based on the most recent Mortgage that was taken out on this home.
Original Mortgage
$147,000
Outstanding Balance
$134,700
Interest Rate
2.99%
Mortgage Type
New Conventional
Estimated Equity
$194,622
Purchase Details
Closed on
Jun 12, 2020
Sold by
Castaneda Jose E and Castaneda Perez Jennie
Bought by
Perez Jennie
Home Financials for this Owner
Home Financials are based on the most recent Mortgage that was taken out on this home.
Original Mortgage
$114,000
Interest Rate
3.2%
Mortgage Type
New Conventional
Purchase Details
Closed on
Jun 8, 2011
Sold by
James Ray Inc
Bought by
Castaneda Jose E and Castaneda Perez Jennie
Home Financials for this Owner
Home Financials are based on the most recent Mortgage that was taken out on this home.
Original Mortgage
$121,761
Interest Rate
4.71%
Mortgage Type
New Conventional
Create a Home Valuation Report for This Property
The Home Valuation Report is an in-depth analysis detailing your home's value as well as a comparison with similar homes in the area
Home Values in the Area
Average Home Value in this Area
Purchase History
| Date | Buyer | Sale Price | Title Company |
|---|---|---|---|
| Castaneda Jennie P | -- | Titleone Twin Falls | |
| Perez Jennie | -- | Titleone Twin Falls | |
| Castaneda Jose E | -- | -- |
Source: Public Records
Mortgage History
| Date | Status | Borrower | Loan Amount |
|---|---|---|---|
| Open | Castaneda Jennie P | $147,000 | |
| Closed | Perez Jennie | $114,000 | |
| Previous Owner | Castaneda Jose E | $121,761 |
Source: Public Records
Tax History Compared to Growth
Tax History
| Year | Tax Paid | Tax Assessment Tax Assessment Total Assessment is a certain percentage of the fair market value that is determined by local assessors to be the total taxable value of land and additions on the property. | Land | Improvement |
|---|---|---|---|---|
| 2024 | $998 | $287,347 | $74,950 | $212,397 |
| 2023 | $1,401 | $289,527 | $74,950 | $214,577 |
| 2022 | $1,330 | $245,008 | $59,960 | $185,048 |
| 2021 | $1,455 | $207,819 | $44,415 | $163,404 |
| 2020 | $1,104 | $140,996 | $42,325 | $98,671 |
| 2019 | $1,077 | $135,729 | $39,930 | $95,799 |
| 2017 | $1,016 | $123,123 | $36,300 | $86,823 |
| 2016 | $990 | $120,594 | $36,300 | $84,294 |
| 2015 | $960 | $116,434 | $33,000 | $83,434 |
| 2014 | $947 | $116,434 | $33,000 | $83,434 |
| 2013 | $947 | $116,434 | $33,000 | $83,434 |
Source: Public Records
Map
Nearby Homes
- 2726 Fairmont Dr
- 628 W 24th St
- 590 W 24th St
- 2593 Burton Ave
- 431 Pratt Place
- 262 Ferdinand Cir
- 2140 Daven Place
- 731 Clear Springs St
- 2435 Oakley Ave Unit Burley, ID
- 1942 Burton Ave
- 301 E 27th St
- 1729 Yale Ave
- 2960 Mcbride Place
- 201 W 19th St
- 519 Lake Cleveland St
- 320 E 23rd Dr
- 1719 Burton Ave
- 160 S 100 W
- 1610 Burton Ave
- 2441 Dorchester Ave
- 2627 Yellowstone Trail
- 2611 Yellowstone Trail
- TBD C Yellowstone Trail
- TBD B Yellowstone Trail
- TBD A Yellowstone Trail
- 2604 Denali Dr
- 2612 Denali Dr
- 2544 Denali Dr
- 2603 S Yellowstone Trail
- 2635 Yellowstone Trail
- 2620 Denali Dr
- 2536 Denali Dr
- 2628 Yellowstone Trail
- 2612 Yellowstone Trail
- 2636 Yellowstone Trail
- TBD Denali Dr
- 2543 Yellowstone Trail
- 2528 Denali Dr
- 2636 Denali Dr
- 2544 Yellowstone Trail