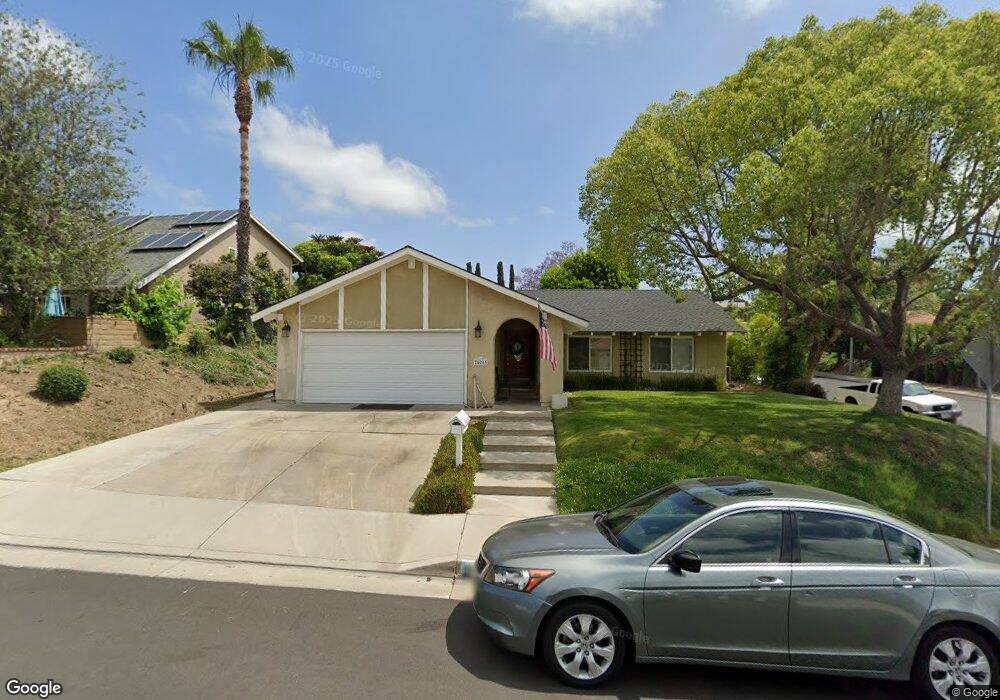
26261 Papagayo Dr Mission Viejo, CA 92691
Estimated Value: $1,094,781 - $1,230,000
3
Beds
2
Baths
1,360
Sq Ft
$862/Sq Ft
Est. Value
About This Home
This home is located at 26261 Papagayo Dr, Mission Viejo, CA 92691 and is currently estimated at $1,171,945, approximately $861 per square foot. 26261 Papagayo Dr is a home located in Orange County with nearby schools including Montevideo Elementary School, La Paz Intermediate School, and Mission Viejo High School.
Ownership History
Date
Name
Owned For
Owner Type
Purchase Details
Closed on
Aug 26, 2004
Sold by
Moore Roxane Kushner
Bought by
Moore Roxane K and Roxane Kushner Moore Trust
Current Estimated Value
Purchase Details
Closed on
Apr 30, 1997
Sold by
Kushner Frederick and Kushner Doris L
Bought by
Moore Roxane Kushner
Purchase Details
Closed on
Oct 24, 1995
Sold by
Froeschle Gudrun K S
Bought by
Kushner Frederick and Kushner Doris L
Home Financials for this Owner
Home Financials are based on the most recent Mortgage that was taken out on this home.
Original Mortgage
$157,500
Interest Rate
7.55%
Purchase Details
Closed on
Sep 27, 1995
Sold by
Gordon Silvia
Bought by
Froeschle Gudrun K S
Home Financials for this Owner
Home Financials are based on the most recent Mortgage that was taken out on this home.
Original Mortgage
$157,500
Interest Rate
7.55%
Create a Home Valuation Report for This Property
The Home Valuation Report is an in-depth analysis detailing your home's value as well as a comparison with similar homes in the area
Home Values in the Area
Average Home Value in this Area
Purchase History
| Date | Buyer | Sale Price | Title Company |
|---|---|---|---|
| Moore Roxane K | -- | None Available | |
| Moore Roxane Kushner | -- | -- | |
| Kushner Frederick | $175,000 | California Counties Title Co | |
| Froeschle Gudrun K S | -- | California Counties Title Co |
Source: Public Records
Mortgage History
| Date | Status | Borrower | Loan Amount |
|---|---|---|---|
| Previous Owner | Kushner Frederick | $157,500 |
Source: Public Records
Tax History Compared to Growth
Tax History
| Year | Tax Paid | Tax Assessment Tax Assessment Total Assessment is a certain percentage of the fair market value that is determined by local assessors to be the total taxable value of land and additions on the property. | Land | Improvement |
|---|---|---|---|---|
| 2025 | $2,822 | $285,009 | $188,319 | $96,690 |
| 2024 | $2,822 | $279,421 | $184,626 | $94,795 |
| 2023 | $2,754 | $273,943 | $181,006 | $92,937 |
| 2022 | $2,703 | $268,572 | $177,457 | $91,115 |
| 2021 | $2,648 | $263,306 | $173,977 | $89,329 |
| 2020 | $2,624 | $260,607 | $172,193 | $88,414 |
| 2019 | $2,570 | $255,498 | $168,817 | $86,681 |
| 2018 | $2,521 | $250,489 | $165,507 | $84,982 |
| 2017 | $2,469 | $245,578 | $162,262 | $83,316 |
| 2016 | $2,427 | $240,763 | $159,080 | $81,683 |
| 2015 | $2,397 | $237,147 | $156,690 | $80,457 |
| 2014 | $2,343 | $232,502 | $153,621 | $78,881 |
Source: Public Records
Map
Nearby Homes
- 24312 Chrisanta Dr
- 24201 Salero Ln
- 25981 Cordillera Dr
- 26511 Naccome Dr
- 24412 Verena Ct
- 24752 San Doval Ln
- 25835 Appian Way
- 24751 Daphne E
- 24812 Leto Cir
- 24771 Daphne E
- 25742 Appian Way
- 26511 Granvia Dr
- 26862 Salazar Dr
- 23641 Coronel Dr
- 26752 Carretas Dr
- 23962 Warsaw St
- 24762 Acropolis Dr
- 24711 Acropolis Dr
- 24755 Acropolis Dr
- 24612 Artemia Ave
- 26251 Papagayo Dr
- 26292 Pacato Dr
- 26282 Pacato Dr
- 26256 Papagayo Dr
- 26235 Papagayo Dr
- 26312 Pacato Dr
- 26252 Papagayo Dr
- 26276 Pacato Dr
- 26272 Papagayo Dr
- 26291 Papagayo Dr
- 26242 Papagayo Dr
- 26322 Pacato Dr
- 26282 Papagayo Dr
- 26301 Papagayo Dr
- 24262 Barquero Dr
- 26232 Papagayo Dr
- 26272 Pacato Dr
- 26291 Pacato Dr
- 26292 Papagayo Dr
- 26332 Pacato Dr