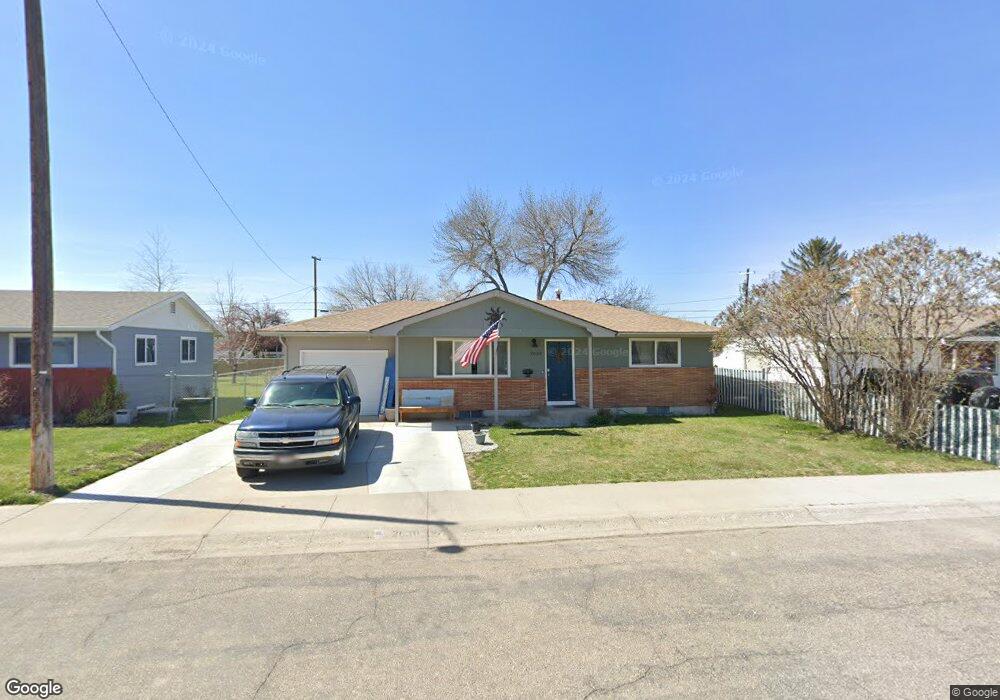
2630 Brentwood Ave Burley, ID 83318
Estimated Value: $278,000 - $316,000
2
Beds
1
Bath
1,296
Sq Ft
$224/Sq Ft
Est. Value
About This Home
This home is located at 2630 Brentwood Ave, Burley, ID 83318 and is currently estimated at $290,580, approximately $224 per square foot. 2630 Brentwood Ave is a home located in Cassia County with nearby schools including Mountain View Elementary School, White Pine Elementary School, and Burley Junior High School.
Ownership History
Date
Name
Owned For
Owner Type
Purchase Details
Closed on
Aug 11, 2024
Sold by
Moo View Cow Palace
Bought by
Searle Clifford L
Current Estimated Value
Purchase Details
Closed on
Jul 22, 2019
Sold by
Peterson Thomas and Peterson Alison
Bought by
Dial Courtney M and Dial Preston
Home Financials for this Owner
Home Financials are based on the most recent Mortgage that was taken out on this home.
Original Mortgage
$136,000
Interest Rate
3.82%
Mortgage Type
New Conventional
Purchase Details
Closed on
Jan 28, 2014
Sold by
Wilcox Debra and Tolman Wayne
Bought by
Peterson Thomas and Peterson Alison
Home Financials for this Owner
Home Financials are based on the most recent Mortgage that was taken out on this home.
Original Mortgage
$61,600
Interest Rate
5.5%
Mortgage Type
Adjustable Rate Mortgage/ARM
Purchase Details
Closed on
Jan 6, 2006
Sold by
Cummings Joy and Cummings Gregory Paul
Bought by
Tolman Edward S and Tolman Joy C
Create a Home Valuation Report for This Property
The Home Valuation Report is an in-depth analysis detailing your home's value as well as a comparison with similar homes in the area
Home Values in the Area
Average Home Value in this Area
Purchase History
| Date | Buyer | Sale Price | Title Company |
|---|---|---|---|
| Searle Clifford L | -- | None Listed On Document | |
| Searle Clifford L | -- | None Listed On Document | |
| Dial Courtney M | -- | First American Title Burley | |
| Peterson Thomas | -- | Land Title And Escrow | |
| Tolman Edward S | -- | None Available |
Source: Public Records
Mortgage History
| Date | Status | Borrower | Loan Amount |
|---|---|---|---|
| Previous Owner | Dial Courtney M | $136,000 | |
| Previous Owner | Peterson Thomas | $61,600 |
Source: Public Records
Tax History Compared to Growth
Tax History
| Year | Tax Paid | Tax Assessment Tax Assessment Total Assessment is a certain percentage of the fair market value that is determined by local assessors to be the total taxable value of land and additions on the property. | Land | Improvement |
|---|---|---|---|---|
| 2024 | $811 | $321,994 | $59,002 | $262,992 |
| 2023 | $1,661 | $321,994 | $59,002 | $262,992 |
| 2022 | $1,560 | $270,074 | $47,200 | $222,874 |
| 2021 | $1,492 | $213,419 | $34,965 | $178,454 |
| 2020 | $1,153 | $147,741 | $15,794 | $131,947 |
| 2019 | $861 | $106,133 | $14,900 | $91,233 |
| 2017 | $785 | $92,877 | $12,600 | $80,277 |
| 2016 | $760 | $89,916 | $12,200 | $77,716 |
| 2015 | $740 | $87,220 | $9,504 | $77,716 |
| 2014 | $60 | $87,220 | $9,504 | $77,716 |
| 2013 | $60 | $87,220 | $9,504 | $77,716 |
Source: Public Records
Map
Nearby Homes
- 2726 Fairmont Dr
- 628 W 24th St
- 2593 Burton Ave
- 590 W 24th St
- 431 Pratt Place
- 2140 Daven Place
- 2435 Oakley Ave Unit Burley, ID
- 731 Clear Springs St
- 262 Ferdinand Cir
- 1942 Burton Ave
- 301 E 27th St
- 2960 Mcbride Place
- 519 Lake Cleveland St
- 320 E 23rd Dr
- 201 W 19th St
- 1729 Yale Ave
- 1719 Burton Ave
- 2441 Dorchester Ave
- 600 Oxford St
- 550 Oxford St
- 2622 Brentwood Ave
- 2636 Brentwood Ave
- 2631 Park Ave
- 2623 Park Ave
- 2616 Brentwood Ave
- 2644 Brentwood Ave
- 2637 Park Ave
- 2637 Parke Ave
- 2631 Brentwood Ave
- 2617 Park Ave
- 2623 Brentwood Ave
- 2637 Brentwood Ave
- 2608 Brentwood Ave
- 2652 Brentwood Ave
- 2617 Brentwood Ave
- 2645 Brentwood Ave
- 2609 Park Ave
- 2609 Parke Ave
- 2609 Brentwood Ave
- 2658 Brentwood Ave