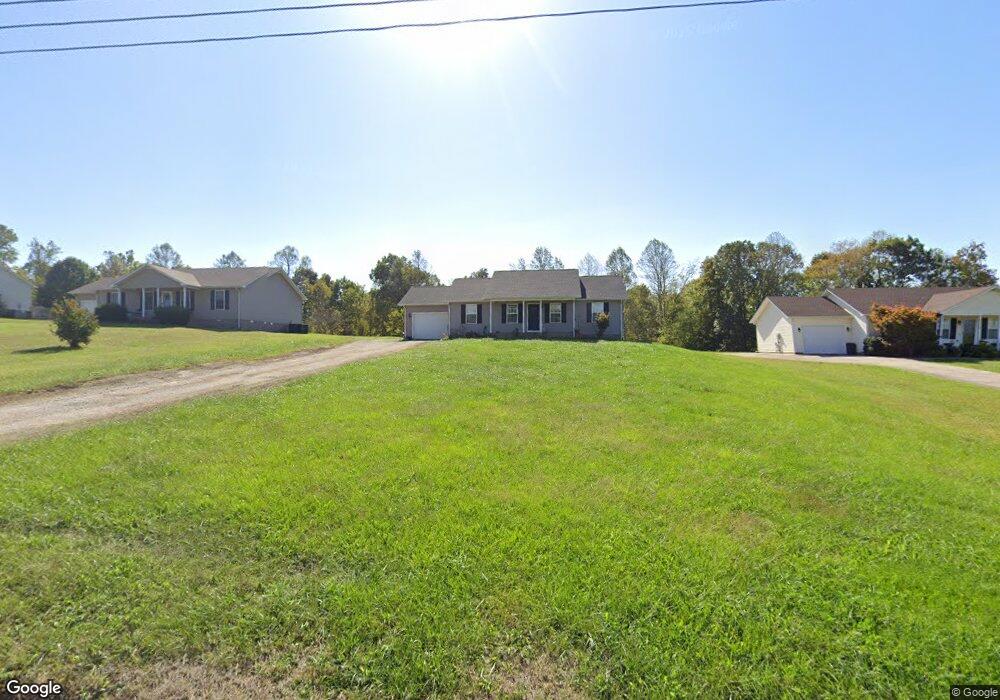
2630 Pippin Rd Cookeville, TN 38501
Estimated Value: $258,308 - $276,000
3
Beds
2
Baths
1,305
Sq Ft
$205/Sq Ft
Est. Value
About This Home
This home is located at 2630 Pippin Rd, Cookeville, TN 38501 and is currently estimated at $267,827, approximately $205 per square foot. 2630 Pippin Rd is a home located in Putnam County with nearby schools including Cane Creek Elementary School, Upperman Middle School, and Upperman High School.
Ownership History
Date
Name
Owned For
Owner Type
Purchase Details
Closed on
Sep 6, 2011
Sold by
Government National Mortga
Bought by
Randolph Shailyn
Current Estimated Value
Home Financials for this Owner
Home Financials are based on the most recent Mortgage that was taken out on this home.
Original Mortgage
$100,000
Interest Rate
4.17%
Mortgage Type
USDA
Purchase Details
Closed on
Apr 26, 2011
Sold by
Dixon Jennifer Gail
Bought by
Government National Mortgage A
Purchase Details
Closed on
Jul 2, 2009
Sold by
Chaffin Dennis
Bought by
Dixon Jennifer Gail
Home Financials for this Owner
Home Financials are based on the most recent Mortgage that was taken out on this home.
Original Mortgage
$111,122
Interest Rate
5.27%
Purchase Details
Closed on
Apr 3, 1986
Bought by
Mullins Michael A
Purchase Details
Closed on
Apr 10, 1948
Bought by
Kuykendall Laurel
Create a Home Valuation Report for This Property
The Home Valuation Report is an in-depth analysis detailing your home's value as well as a comparison with similar homes in the area
Home Values in the Area
Average Home Value in this Area
Purchase History
| Date | Buyer | Sale Price | Title Company |
|---|---|---|---|
| Randolph Shailyn | $100,000 | -- | |
| Government National Mortgage A | $119,719 | -- | |
| Dixon Jennifer Gail | $108,900 | -- | |
| Mullins Michael A | -- | -- | |
| Kuykendall Laurel | -- | -- |
Source: Public Records
Mortgage History
| Date | Status | Borrower | Loan Amount |
|---|---|---|---|
| Previous Owner | Randolph Shailyn | $100,000 | |
| Previous Owner | Kuykendall Laurel | $111,122 |
Source: Public Records
Tax History Compared to Growth
Tax History
| Year | Tax Paid | Tax Assessment Tax Assessment Total Assessment is a certain percentage of the fair market value that is determined by local assessors to be the total taxable value of land and additions on the property. | Land | Improvement |
|---|---|---|---|---|
| 2024 | $966 | $36,325 | $5,200 | $31,125 |
| 2023 | $966 | $36,325 | $5,200 | $31,125 |
| 2022 | $898 | $36,325 | $5,200 | $31,125 |
| 2021 | $898 | $36,325 | $5,200 | $31,125 |
| 2020 | $894 | $36,325 | $5,200 | $31,125 |
| 2019 | $894 | $30,550 | $5,200 | $25,350 |
| 2018 | $834 | $30,550 | $5,200 | $25,350 |
| 2017 | $834 | $30,550 | $5,200 | $25,350 |
| 2016 | $834 | $30,550 | $5,200 | $25,350 |
| 2015 | $857 | $30,550 | $5,200 | $25,350 |
| 2014 | $787 | $28,066 | $0 | $0 |
Source: Public Records
Map
Nearby Homes
- 2269 Plunk Whitson Rd
- 2450 Whispering Oaks Ln
- 2618 Whispering Oak Ln
- 3815 Spurgeon Dr
- 2694 Whispering Oaks Ln
- 2600 Whispering Oaks Ln
- 2636 Whispering Oaks Ln
- 2312 Benjy Cir
- 2870 Autumn Woods Trail
- 3013 Tulip Ln
- 2770 Autumn Woods Trail
- 2895 Autumn Woods Trail
- 2617 Spring Arbor Ct
- 4028 Winter Haven Dr
- 1764 Bouton Dr
- 1711 Creekside Dr
- 1775 Creekside Dr
- 3134 Westowne Cir
- 1475 Dyer Creek Rd
- 3180 Westowne Cir
- 2660 Pippin Rd
- 2600 Pippin Rd
- 2690 Pippin Rd
- 2570 Pippin Rd
- 2720 Pippin Rd
- 2810 Pippin Rd
- 2515 Watermill Rd
- 2510 Pippin Rd
- 2525 Watermill Rd
- 2535 Watermill Rd
- 2545 Watermill Rd
- 2555 Watermill Rd
- 2550 Watermill Rd
- 2866 Pippin Rd
- 2465 Pippin Rd
- 2565 Watermill Rd
- 2575 Watermill Rd
- 2355 NW Pippin Rd
- 2585 Watermill Rd
- 2355 Pippin Rd