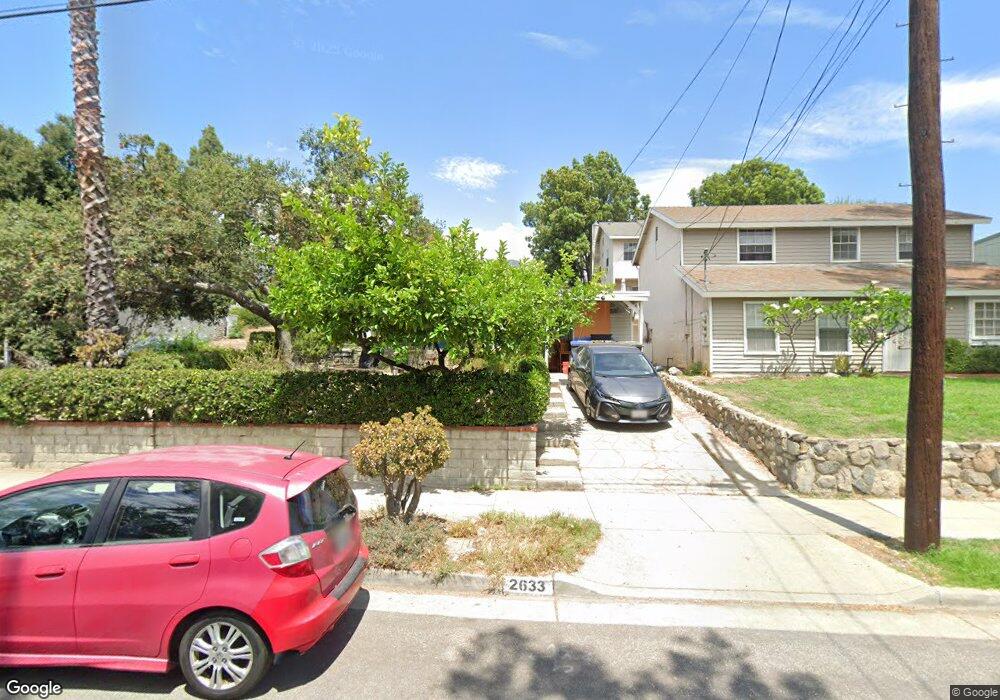
2633 Piedmont Ave Montrose, CA 91020
Sparr Heights NeighborhoodEstimated Value: $605,228 - $865,000
1
Bed
1
Bath
520
Sq Ft
$1,450/Sq Ft
Est. Value
About This Home
This home is located at 2633 Piedmont Ave, Montrose, CA 91020 and is currently estimated at $753,807, approximately $1,449 per square foot. 2633 Piedmont Ave is a home located in Los Angeles County with nearby schools including La Crescenta Elementary School, Rosemont Middle School, and Crescenta Valley High School.
Ownership History
Date
Name
Owned For
Owner Type
Purchase Details
Closed on
Jun 28, 2023
Sold by
Stockly Jane L and Stockly Edwin W
Bought by
Edwin/Jane Stockly Living Trust and Stockly
Current Estimated Value
Purchase Details
Closed on
Jun 12, 2012
Sold by
Stockly Edwin W and Stockly Jane L
Bought by
Stockly Edwin W and Stockly Jane L
Purchase Details
Closed on
Jul 14, 1994
Sold by
Nicholson Gary L and Soloway Jay S
Bought by
Stockly Edwin W and Stockly Jane L
Home Financials for this Owner
Home Financials are based on the most recent Mortgage that was taken out on this home.
Original Mortgage
$109,250
Interest Rate
8.25%
Purchase Details
Closed on
Jun 14, 1994
Sold by
Federal Home Loan Mortgage Corporation
Bought by
Nicholson Gary L and Soloway Jay S
Home Financials for this Owner
Home Financials are based on the most recent Mortgage that was taken out on this home.
Original Mortgage
$109,250
Interest Rate
8.25%
Purchase Details
Closed on
Mar 11, 1994
Sold by
California Reconveyance Company
Bought by
Federal Home Loan Mortgage Corporation
Create a Home Valuation Report for This Property
The Home Valuation Report is an in-depth analysis detailing your home's value as well as a comparison with similar homes in the area
Home Values in the Area
Average Home Value in this Area
Purchase History
| Date | Buyer | Sale Price | Title Company |
|---|---|---|---|
| Edwin/Jane Stockly Living Trust | -- | None Listed On Document | |
| Stockly Edwin W | -- | None Available | |
| Stockly Edwin W | $115,000 | World Title Company | |
| Nicholson Gary L | $85,000 | -- | |
| Federal Home Loan Mortgage Corporation | $90,000 | Chicago Title Company |
Source: Public Records
Mortgage History
| Date | Status | Borrower | Loan Amount |
|---|---|---|---|
| Previous Owner | Stockly Edwin W | $109,250 | |
| Previous Owner | Nicholson Gary L | $66,700 |
Source: Public Records
Tax History Compared to Growth
Tax History
| Year | Tax Paid | Tax Assessment Tax Assessment Total Assessment is a certain percentage of the fair market value that is determined by local assessors to be the total taxable value of land and additions on the property. | Land | Improvement |
|---|---|---|---|---|
| 2025 | $2,359 | $193,131 | $154,517 | $38,614 |
| 2024 | $2,306 | $189,345 | $151,488 | $37,857 |
| 2023 | $2,259 | $185,633 | $148,518 | $37,115 |
| 2022 | $2,025 | $181,994 | $145,606 | $36,388 |
| 2021 | $1,989 | $178,426 | $142,751 | $35,675 |
| 2020 | $1,959 | $176,598 | $141,288 | $35,310 |
| 2019 | $1,912 | $173,136 | $138,518 | $34,618 |
| 2018 | $1,846 | $169,742 | $135,802 | $33,940 |
| 2016 | $1,756 | $163,153 | $130,530 | $32,623 |
| 2015 | $1,719 | $160,703 | $128,570 | $32,133 |
| 2014 | $1,711 | $157,556 | $126,052 | $31,504 |
Source: Public Records
Map
Nearby Homes
- 2522 Fairway Ave
- 2710 Piedmont Ave Unit 21
- 2468 Montrose Ave Unit 6
- 3928 La Crescenta Ave
- 2754 Montrose Ave
- 2806 Manhattan Ave
- 2743 Montrose Ave Unit 110
- 4328 Sunset Ave
- 2434 Prospect Ave
- 4326 Briggs Ave
- 4133 La Crescenta Ave
- 2817 Montrose Ave
- 3658 Sierra Vista Ave
- 2700 Prospect Ave
- 2966 Piedmont Ave
- 2249 Montrose Ave Unit 7
- 2619 Mary St
- 2222 Montrose Ave Unit G
- 3010 Montrose Ave Unit 33
- 3010 Montrose Ave Unit 3
- 2629 Piedmont Ave
- 2622 Manhattan Ave
- 2625 Piedmont Ave
- 2641 Piedmont Ave Unit 2
- 2641 Piedmont Ave
- 2616 Manhattan Ave
- 2642 Manhattan Ave
- 2621 Piedmont Ave
- 2636 Manhattan Ave
- 2612 Manhattan Ave
- 2630 Piedmont Ave
- 2604 Piedmont Ave
- 2602 Piedmont Ave
- 3914 Pleasure Way
- 2626 Piedmont Ave
- 2617 Piedmont Ave
- 2649 Piedmont Ave
- 2639 Manhattan Ave
- 2608 Piedmont Ave
- 3915 Pleasure Way